TESTS · CPU · INTEL
PUBLISHED
READING19 min
Xeon W3565 (Core i7-960) quick benchmark: Testing performance in popular games and apps
A quick benchmark of the Xeon W3565 (Core i7-960) in games and synthetic tests, comparing its performance against rival CPU models.
The Intel Xeon W3565 is one of the highest-clocked Nehalem CPUs based on the 45nm Bloomfield die. It also happens to be a carbon copy of the desktop Core i7-960. These two factors make it a popular choice for ultra-budget gaming rigs and workstations. However, this CPU has a few major drawbacks. Some are obvious, like supporting only slow DDR3-1066 memory. Others, like the painfully slow memory controller and L3 cache speed (locked at just 2133 MHz), are quietly swept under the rug by Intel. Yet, RAM and L3 cache speeds heavily impact gaming and overall CPU performance.
For a Core i7-960 user, things are straightforward: if your motherboard doesn't support Xeon CPUs, you don't really have a choice. However, if your board does support server processors, choosing the Xeon W3565 (or alternatives like the W3530 and W3550) makes little sense.
Let me explain: right next door in the actual server lineup sits the Xeon X55xx series. Starting with the X5550, these chips feature an integrated memory controller running at 2667 MHz and support faster DDR3-1333 RAM.
We could wrap up the discussion right here, but there is a catch: Nehalem is an aging architecture, and the real-world benefits of a faster memory controller and L3 cache might only exist on paper. That's why I decided to test them and find out if there's a real-world performance difference between a 2133 MHz and 2667 MHz memory controller, and DDR3-1066 versus DDR3-1333, using the Intel Xeon X5570 and Xeon W3565.
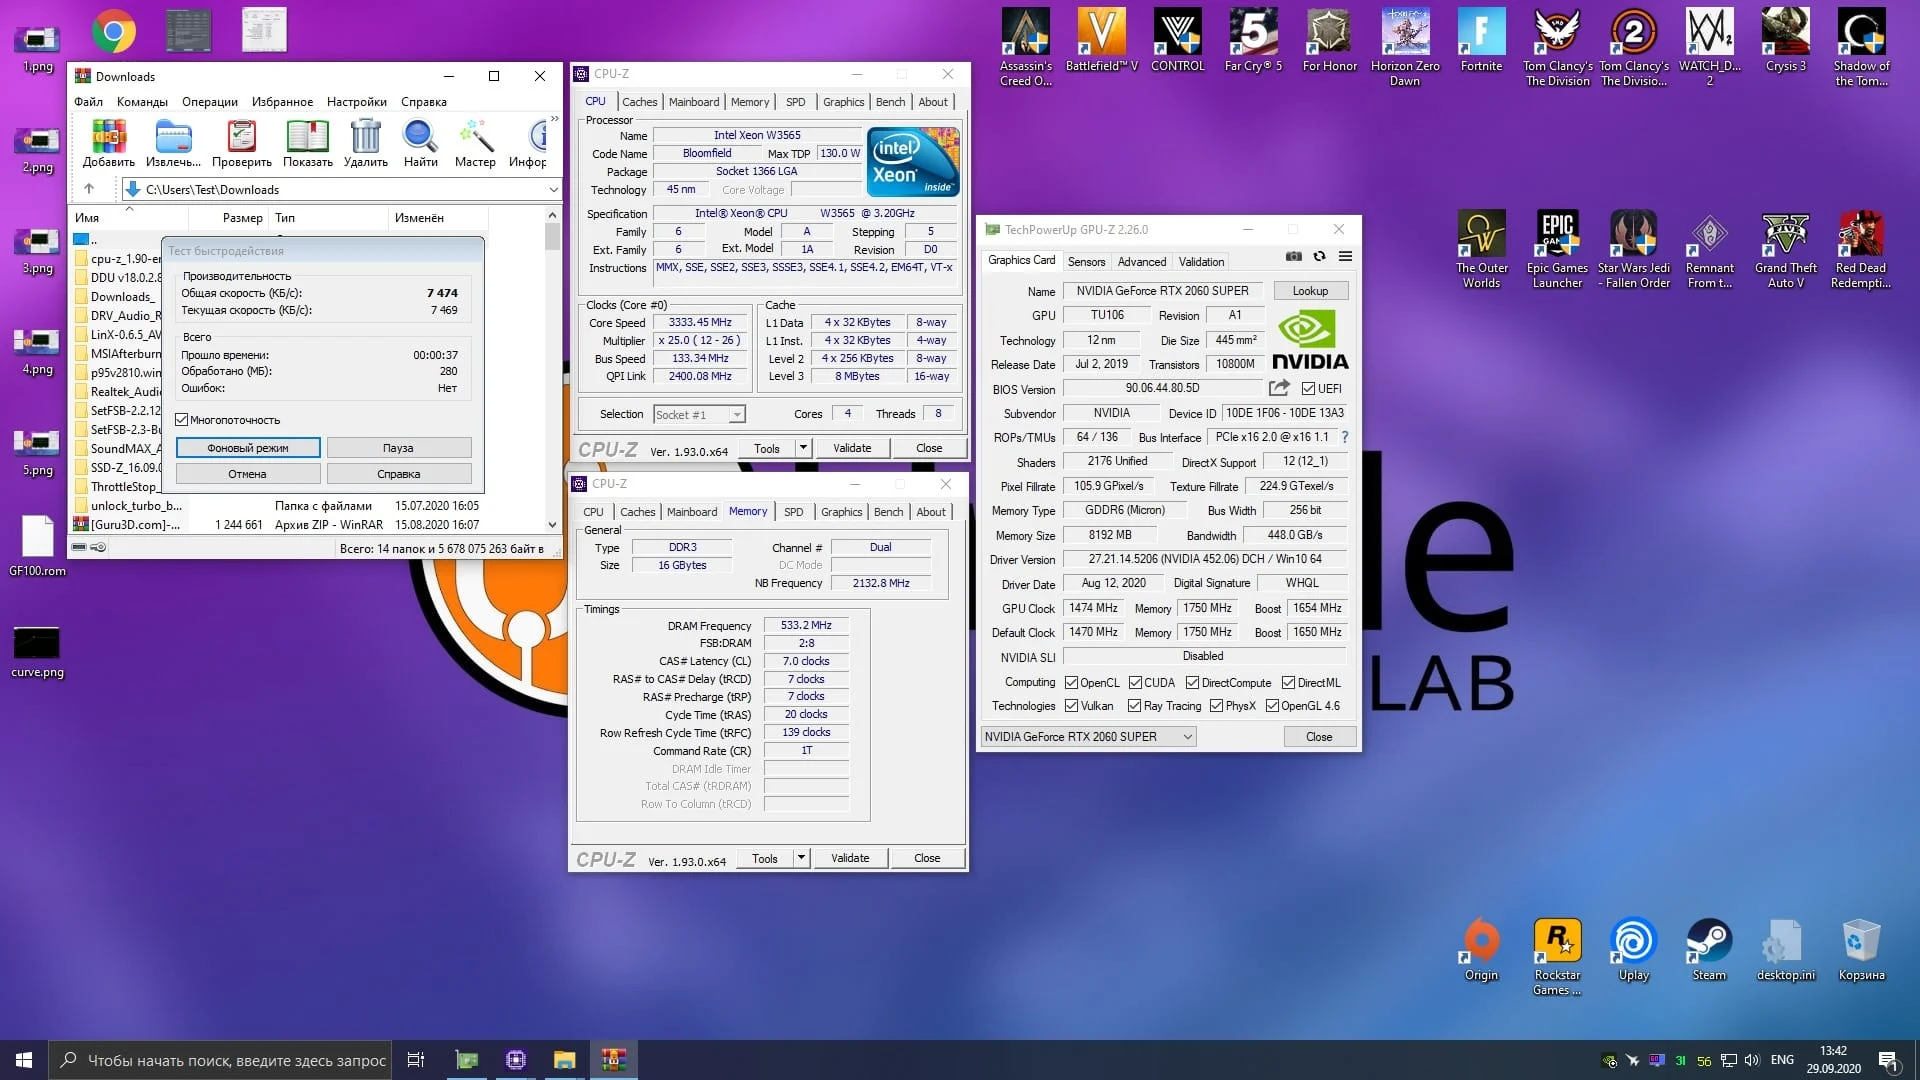
Here is a comparison screenshot of the Intel Xeon X5570, Core i7-960, and Xeon W3565:
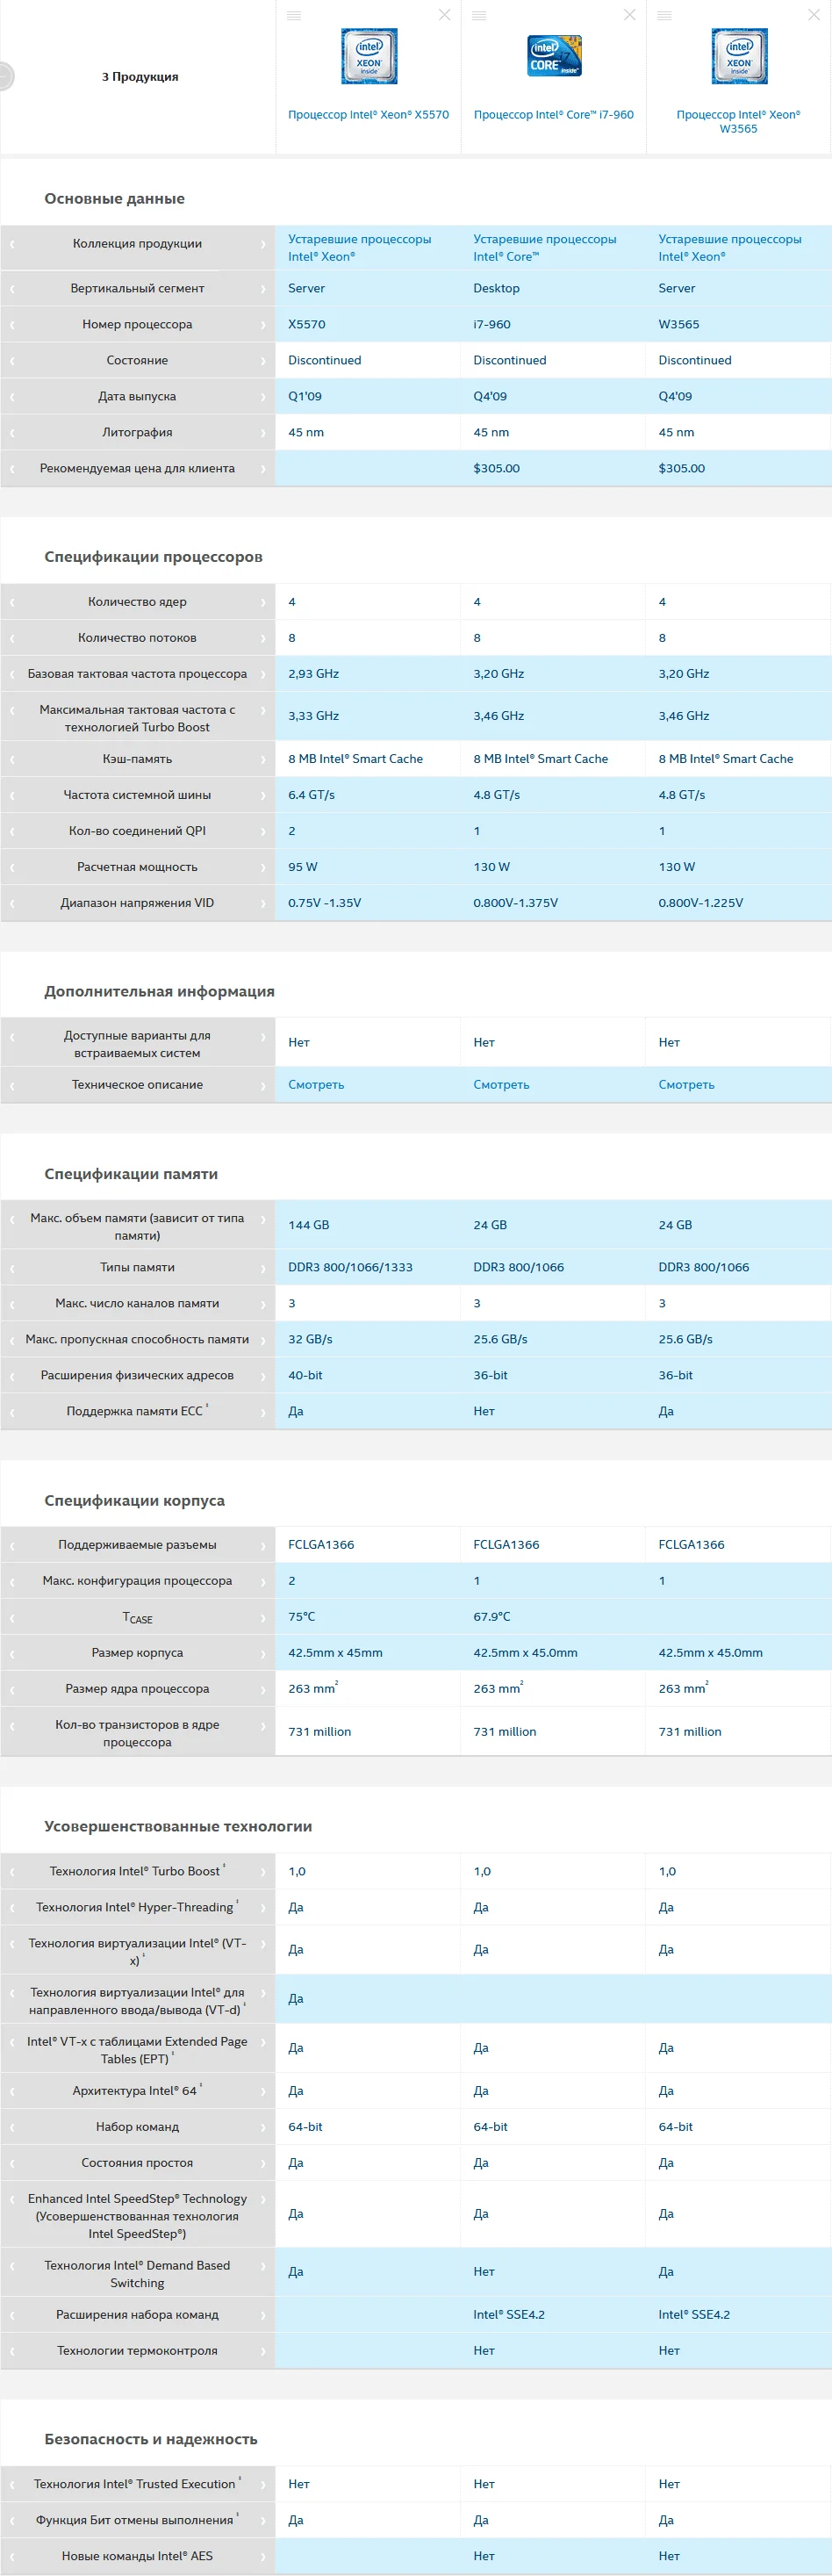 ⤢ ВІДКРИТИ
The only major difference between the Xeon W3565 and the Core i7-960 is that the latter lacks ECC memory support. Since this has zero impact on performance, the benchmark results for the Xeon W3565 will apply equally to the desktop Core i7-960.
The X5570, however, stands out from its siblings. For starters, it supports DDR3-1333 RAM. Its QPI speed is higher at 3200 MHz (6.4 GT/s), and its maximum operating temperature is extended to 75°C. But it's not all smooth sailing: the X5570's all-core turbo boost tops out at 3200 MHz, whereas the W3565 can reach 3333 MHz. Whether this 133 MHz advantage can hand the W3565 a win is a question we'll answer below.
Welcome to the third part of our September benchmarking series!
Processor
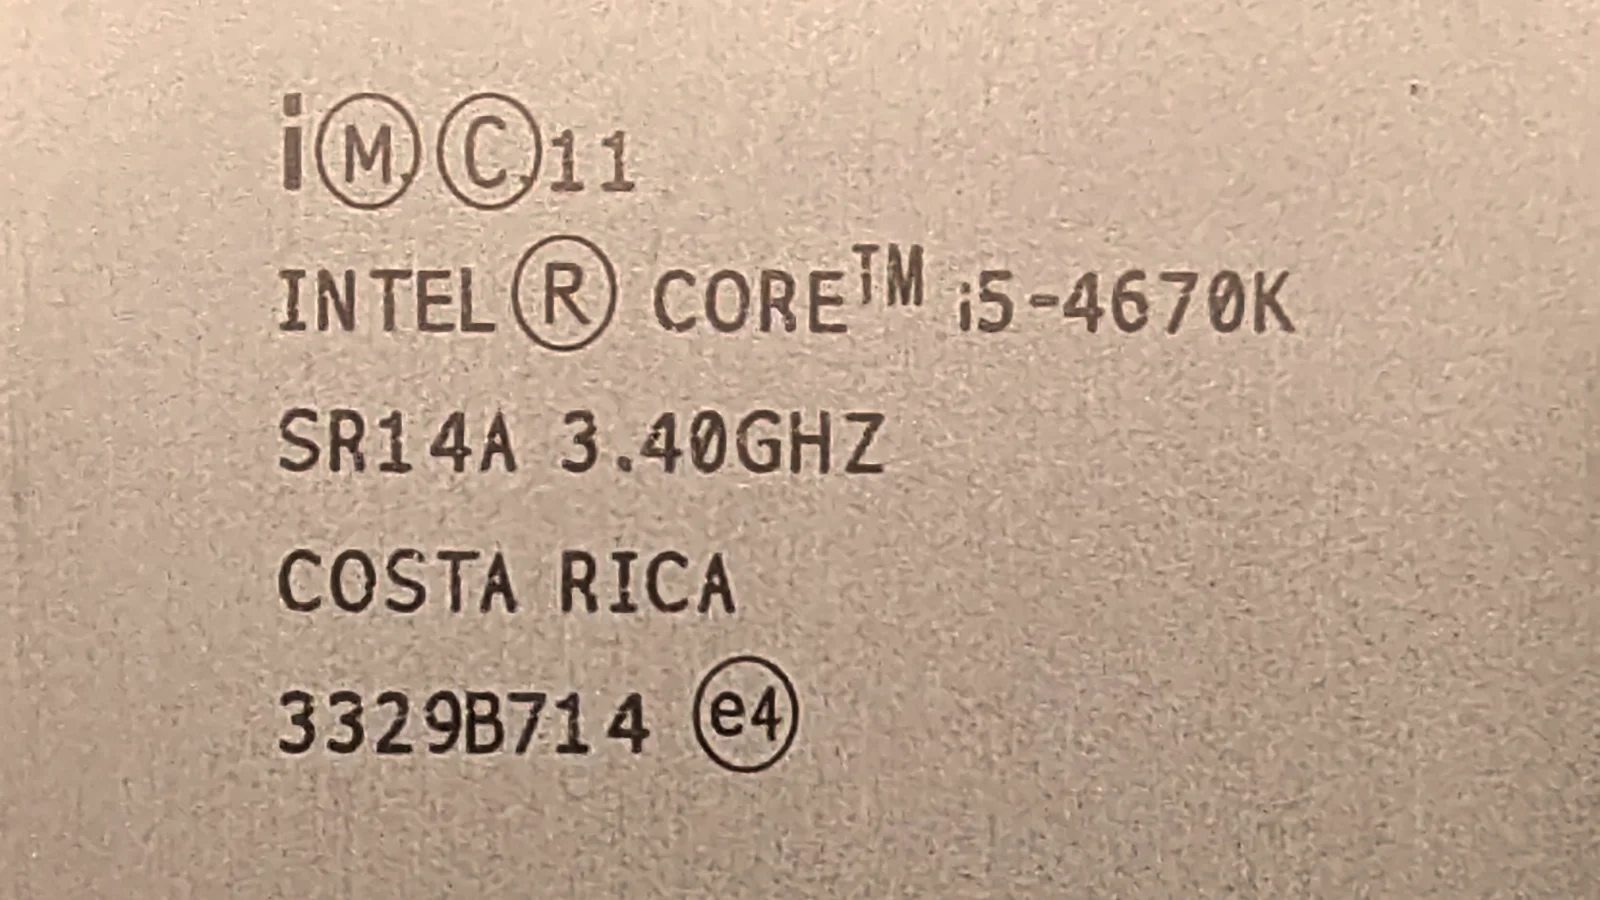
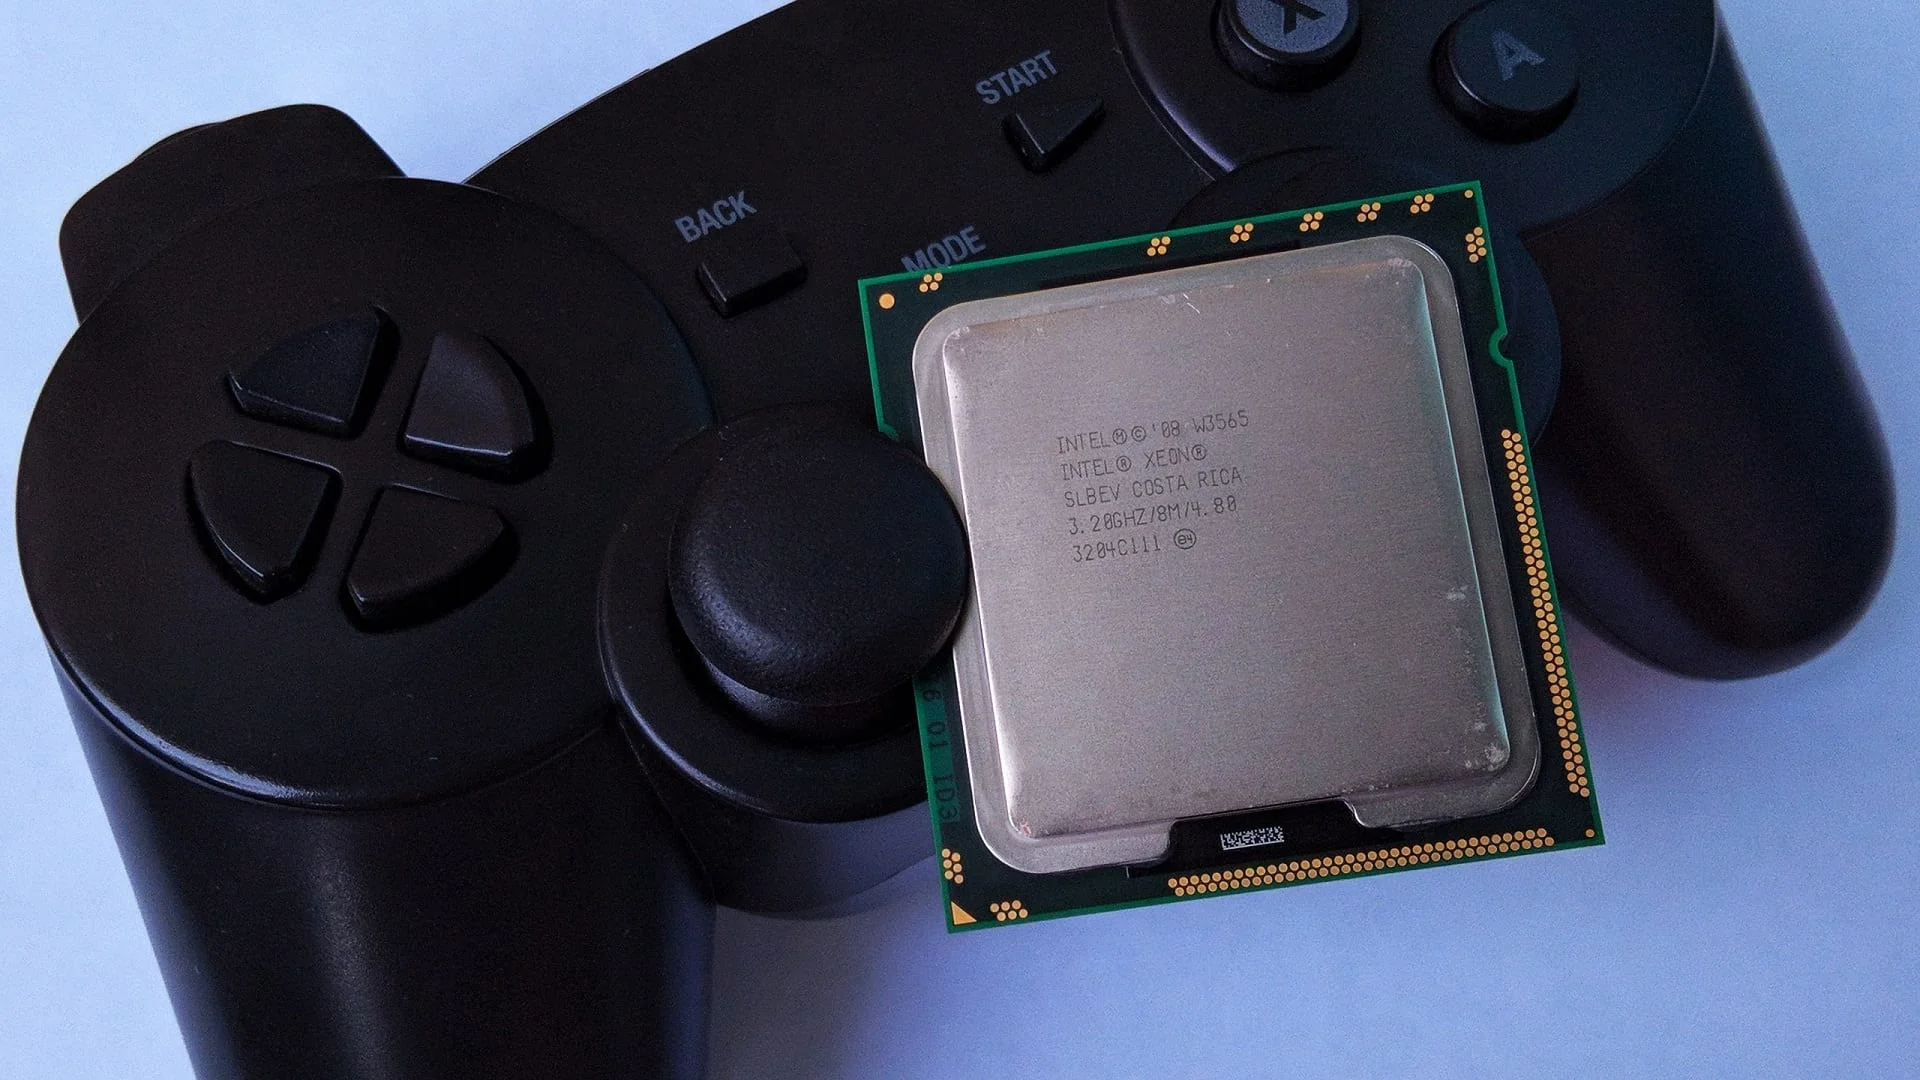
Our test sample carries the SLBEV sSpec code, was made in Costa Rica, and has a base clock of 3200 MHz.
Under the hood, the Intel Xeon W3565 features a 45nm, 4-core, 8-thread Bloomfield die designed for LGA 1366 motherboards. It has a maximum single-core turbo boost of 3400 MHz, though all-core boost is capped at 3333 MHz. The QPI speed is 2400 MHz (4.8 GT/s).
The Xeon W3565 features 256 KB of L2 cache per core and a shared 8 MB L3 cache. Its integrated memory controller and L3 cache are locked at 2133 MHz, while memory support is capped at DDR3-1066.
Specifications of all tested CPUs:
Processor | Xeon W3565 | Xeon X5570 | Xeon X5660 | Xeon E5-2643 | Xeon E5-2620 | Xeon E5-2620v3 | Xeon E5-2630Lv3 |
Socket | LGA 1366 | LGA 1366 | LGA 1366 | LGA 2011 | LGA 2011 | LGA 2011 v3 | LGA 2011 v3 |
Base clock | 3200 MHz | 2933 MHz | 2800 MHz | 3300 MHz | 2000 MHz | 2400 MHz | 1800 MHz |
Max clock | 3400 MHz | 3333 MHz | 3200 MHz | 3500 MHz | 2500 MHz | 3200 MHz | 2900 MHz |
Max all-core clock | 3333 MHz | 3200 MHz | 3066 MHz | 3400 MHz | 2300 MHz | 2600 MHz | 2200 MHz |
All-core clock in benchmarks | 3333 MHz | 3200 MHz | 3066 MHz | 3400 MHz | 2300 MHz | 3200 MHz | ~2700 MHz |
Cores | 4 | 4 | 6 | 4 | 6 | 6 | 8 |
Threads | 8 | 8 | 12 | 8 | 12 | 12 | 16 |
Process node | 45 nm | 45 nm | 32 nm | 32 nm | 32 nm | 22 nm | 22 nm |
L2 cache (per core) | 256 KB | 256 KB | 256 KB | 256 KB | 256 KB | 256 KB | 256 KB |
L3 cache (total) | 8 MB | 8 MB | 12 MB | 10 MB | 15 MB | 15 MB | 20 MB |
L3/IMC clock | 2133 MHz | 2666 MHz | 2666 MHz | Tied to core clock | Tied to core clock | 3000 MHz | 2900 MHz |
TDP | 130 W | 95 W | 95 W | 130 W | 95 W | 85 W | 55 W |
Memory channels | Triple-channel | Triple-channel | Triple-channel | Quad-channel | Quad-channel | Quad-channel | Quad-channel |
Memory support | DDR3-1066 MHz | DDR3-1333 MHz | DDR3-1333 MHz | DDR3-1333 MHz | DDR3-1333 MHz | DDR4-1866 MHz | DDR4-1866 MHz |
Price (as of Oct 13, 2020) | ~$3 | $8 | $13 | $15 | ~$5 | $20 | $25 |
You can find more detailed specs, design close-ups, and a brief overview of the other featured CPUs in the first and second parts of our September benchmarking session.
Test setup:
Processors — Xeon E5-2620, Xeon E5-2620 v3, Xeon E5-2630L v3, Xeon E5-2643, Xeon W3565, Xeon X5570, and Xeon X5660;
Cooling — Cooler Master Hyper 212 Black Edition (RR-212S-20PK-R1);
LGA 1366 RAM — 2x 8GB HyperX Genesis Na’Vi Edition (KHX16C9C2K2/8), 16GB total;
LGA 2011 RAM — 2x 8GB Micron MT36JSF1G72PZ-1G4M1HF, 16GB total;
LGA 2011 v3 RAM — 4x 4GB G.SKILL DDR4 @ 1866MHz F4-2400C15S-4GNT, 16GB total (10-10-10-24 timings);
LGA 2011 motherboard — DELL T3610 (09M8Y8);
LGA 2011 v3 motherboard — Kllisre X99-D8 (AD12) with modified BIOS (unlocked Turbo Boost and timing control);
LGA 1366 motherboard — DELL T3500 (09KPNV);
Graphics card — KFA2 GeForce RTX 2060 SUPER 8GB (115% Power Limit);
SSD — KINGSTON 120GB SA400S37120G (Windows 10 1903/Apps);
HDD — Seagate 2TB ST2000DM008-2FR102 (Games);
Power supply — Chieftec GPS-1250C.
Software:
Windows 10 Pro v1909 x64;
CPU-Z v1.93.0 x64;
AIDA64 v6.10.5200;
NVIDIA Driver v452.06;
Cinebench R15.38;
Cinebench R20.060;
xNormal 3.19.3.39669 x64 (NM Map antialiasing x4, AO Map antialiasing x1);
Blender 2.90.0;
HWBot x265 Benchmark v2.0.0;
WinRAR v5.91 x64;
7-Zip v20.02 alpha x64.
Games and graphics settings:
Open me+
Assassin’s Creed Odyssey: API — DirectX 11; Display Mode — Fullscreen; Resolution — 1280×720; Resolution Modifier — 100%; VSync — Off; Graphics Preset — Max; Adaptive Quality — Off; Anti-Aliasing — Off; Shadows — Ultra; Environment — Ultra; Texture Detail — High; Terrain — High; Clutter Density — Ultra; Fog — High; Water — Ultra; Screen Space Reflections — High; Volumetric Clouds — Ultra; Character Texture Detail — High; Character — High; Volumetric Lighting — Ultra; Depth of Field — High. Battlefield V: API — DirectX 12; Display Mode — Fullscreen; Resolution — 1280×720; Chromatic Aberration — Yes; Film Grain — Yes; Vignette — Yes; Lens Distortion — Yes; DXR Enabled — Yes; RTX DLSS — Yes; Framerate Limit — 200; Future Frame Rendering — No; VSync — No; GPU Memory Restriction — No; Graphics Quality — Ultra; Texture Quality — Ultra; Lighting Quality — Ultra; Effects Quality — Ultra; Post-Processing Quality — Ultra; Mesh Quality — Ultra; Terrain Quality — Ultra; Undergrowth Quality — Ultra; Ambient Occlusion — HBAO; Ray Tracing Reflection Quality — Ultra; High Fidelity Objects Amount — Ultra; Control Ultimate Edition: API — DirectX 12; Display Mode — Fullscreen; Resolution — 1280×720; Render Resolution — 853×480; NVIDIA DLSS — On; VSync — Off; Graphics Preset — High; Far Object Detail — High; Texture Quality — High; Texture Filtering — High; Shadow Resolution — High; Shadow Filtering — Medium; Volumetric Lighting — High; Terrain Quality — Medium; SSAO — On; Screen Space Reflections — Medium (this option is unavailable when RTX is enabled); Global Reflections — High; MSAA — 2X; Film Grain — On; Motion Blur — On; Ray Tracing — On; Ray Tracing Quality Preset — High (if disabled, all nested options are also disabled); Ray-Traced Reflections — On; Ray-Traced Transparent Reflections — On; Ray-Traced Indirect Diffuse Lighting — On; Ray-Traced Contact Shadows — On; Ray-Traced Debris — On; Counter-Strike: Global Offensive: API — DirectX 9; Resolution — 1280×720; Display Mode — Fullscreen; Global Shadow Quality — High; Model / Texture Detail — High; Texture Streaming — On; Effect Detail — High; Shader Detail — Very High; Boost Player Contrast — Off; Multicore Rendering — On; Multisampling Anti-Aliasing Mode — 8X MSAA; FXAA Anti-Aliasing — Enabled; Texture Filtering Mode — Anisotropic 16X; VSync — Off; Motion Blur — Off; Triple-Monitor Mode — Off. Destiny 2: API — DirectX 11; Display Mode — Fullscreen; Resolution — 1280×720; VSync — Off; Framerate Cap — Off; Field of View — 105; Graphics Preset — Highest; Anti-Aliasing — SMAA; Ambient Occlusion — 3D; Anisotropic Texture Filtering — 16X; Texture Quality — Highest; Shadow Quality — Highest; Depth of Field — High; Environment Detail Distance — High; Character Detail Distance — High; Foliage Detail Distance — High; Foliage Shadow Distance — Highest; Light Shafts — High; Motion Blur — On; Wind Impulses — On; Render Resolution — 100%; Chromatic Aberration — On; Film Grain — On. Far Cry 5: API — DirectX 11; Display Mode — Fullscreen; Resolution — 1280×720; Graphics Quality — Ultra; Texture Filtering — Max; Shadows — Max; Geometry & Vegetation — Max; Water — High; Terrain — High; Volumetric Fog — High; HD Textures — Off; Anti-Aliasing — TAA; Motion Blur — Off; VSync — Off; FOV Scale — 75 degrees; Dynamic Resolution — Off; Resolution Scale — 1 (100%). For Honor: API — DirectX 11; Display Mode — Fullscreen; Resolution — 1280×720; VSync — Off; Field of View — 70; Image Quality — Extreme; Texture Filtering — Anisotropic 16X; Anti-Aliasing — TAA; Render Scaling — 100%; Geometric Detail — Very High; Texture Quality — High; Dynamic Shadows — Very High; Terrain Detail — High; Ambient Occlusion — MHBAO; Dynamic Reflections — High; Motion Blur — On; Supersampling — Off. Horizon Zero Dawn: API — DirectX 12; Display Mode — Fullscreen; Resolution — 1280×720; Field of View — 70; Adaptive Performance FPS — Off; FPS Limit — Unlimited; Render Scale — 100%; VSync — Off; Preset — Ultimate Quality; Textures — Ultra; Model Quality — Ultra; Anisotropic Filtering — Ultra; Shadows — Ultra; Reflections — High; Clouds — Ultra; Anti-Aliasing — TAA; Motion Blur — On; Ambient Occlusion — Ultra. Red Dead Redemption 2: API — Vulkan; Resolution — 1280×720; Display Mode — Fullscreen; VSync — Off; Texture Quality — Ultra; Anisotropic Filtering — X8; Lighting Quality — Medium; Global Illumination Quality — High; Shadow Quality — High; Far Shadow Quality — High; Screen Space Ambient Occlusion — High; Reflection Quality — Low; Mirror Quality — High; Water Quality — High; Volumetrics Quality — Medium; Particle Quality — Medium; Tessellation Quality — High; TAA — Off; FXAA — On; MSAA — Off; Near Volumetric Resolution — Medium; Far Volumetric Resolution — Medium; Volumetric Lighting Quality — Medium; Unlocked Volumetric Raymarch Resolution — Off; Particle Lighting Quality — Medium; Soft Shadows — Ultra; Grass Shadows — Medium; Long Shadows — On; Full Resolution SSAO — On; Water Refraction Quality — High; Water Reflection Quality — High; Water Physics Quality — High; Resolution Scale — Off; TAA Sharpening — Low; Motion Blur — On; Reflection MSAA — Off; Geometry Level of Detail — Ultra; Grass Detail — Medium; Tree Quality — Medium; Parallax Occlusion Mapping Quality — Ultra; Decal Quality — High; Fur Quality — Medium; Tree Tessellation — Off. Remnant: From the Ashes: API — DirectX 11; Display Mode — Fullscreen; Resolution — 1280×720; Motion Blur — On; VSync — Off; Shadow Distance — 100; Shadow Quality — Ultra; Anti-Aliasing — Ultra; View Distance — Ultra; Textures — Ultra; Post-Processing — Ultra; Effects — Ultra; Foliage Quality — Ultra; Framerate Limit — 0; Minimize Input Latency — On; Field of View — 1. Shadow of the Tomb Raider: API — DirectX 12; Resolution — 1280×720; NVIDIA RTX DLSS — On; Display Mode — Fullscreen; Exclusive Fullscreen — On; VSync — Off; Preset — Ultra; Texture Quality — Ultra; Ray-Traced Shadow Quality — Ultra; Ambient Occlusion — HBAO+; Depth of Field — High; Level of Detail — Ultra; Tessellation — On; Bloom — On; Motion Blur — On; Screen Space Reflections — On; Screen Space Contact Shadows — High; PureHair — Medium; Volumetric Lighting — On; Lens Flares — On; Screen Effects — On. Tom Clancy’s The Division 2: API — DirectX 12; Display Mode — Fullscreen; Resolution — 1280×720; Reduce Input Lag — On (slightly reduces input lag at the cost of a minor performance hit); Graphics Quality — Custom (disabling VSync in this game switches the graphics preset to 'Custom' without changing other settings); VSync — Off; Framerate Limit — Off; Shadow Quality — High; Local Shadows — High; Local Shadow Resolution — High; Contact Shadows — High; Resolution Scale — 100%; Sharpening — 70%; Particle Quality — Ultra; Volumetric Fog — Ultra; Reflection Quality — Medium; Local Reflection Quality — High; Vegetation Quality — Medium; Sub-Surface Scattering — On; Anisotropic Filtering — 16X; Parallax Mapping — On; Ambient Occlusion — High; Depth of Field — On; Object Detail — 100; Extra Streaming Distance — 10; Neutral Lighting — Off; Lens Flare — On; Vignette — On. Water Quality — High; Chromatic Aberration — On; Projected Texture Resolution — 512; High Resolution Sky — On. Terrain Quality — High; Anti-Aliasing — Ultra; Watch_Dogs 2: Window Mode — Fullscreen; Resolution — 1280×720; VSync — Off; FPS Limit — 125; Field of View — 70; Pixel Density — 1.00; Graphics Quality — Ultra; Geometry — Ultra; Extra Detail — 0%; Terrain — Ultra; Vegetation — Ultra; Texture Resolution — Ultra; Texture Filtering — Ultra; Shadows — Ultra; Headlight Shadows — 2 Cars; Water — High; Reflections — High; SSLR — Ultra; Dynamic Particles — On; San Francisco Fog — On; Depth of Field — On; Motion Blur — On; Bloom — On; Volumetric Light — HMSSAO; Temporal Filtering — Off; MSAA — Off; Post-Processing Anti-Aliasing — SMAA.
For a more visual look at the in-game graphics settings, check out the Xeon W3565 video benchmark at the end of this article.
Benchmarks and application testing
Let's start with some basic synthetic benchmarks before moving on to real-world tasks and application suites.
General performance:
CPU-Z benchmark
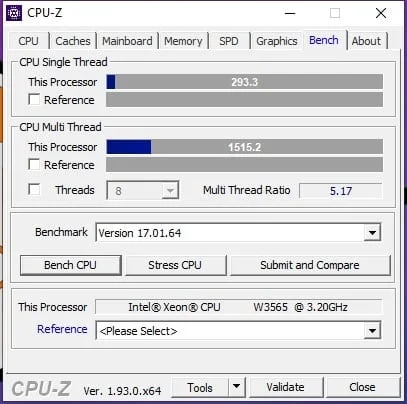 ⤢ ВІДКРИТИ
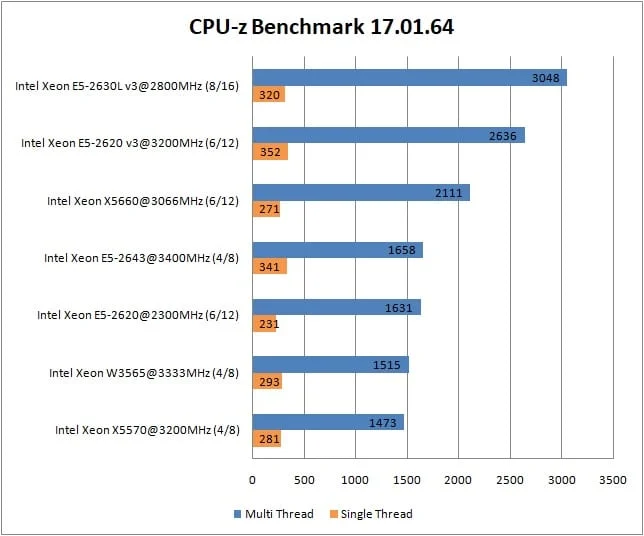 ⤢ ВІДКРИТИ
Rendering benchmarks:
Cinebench R15
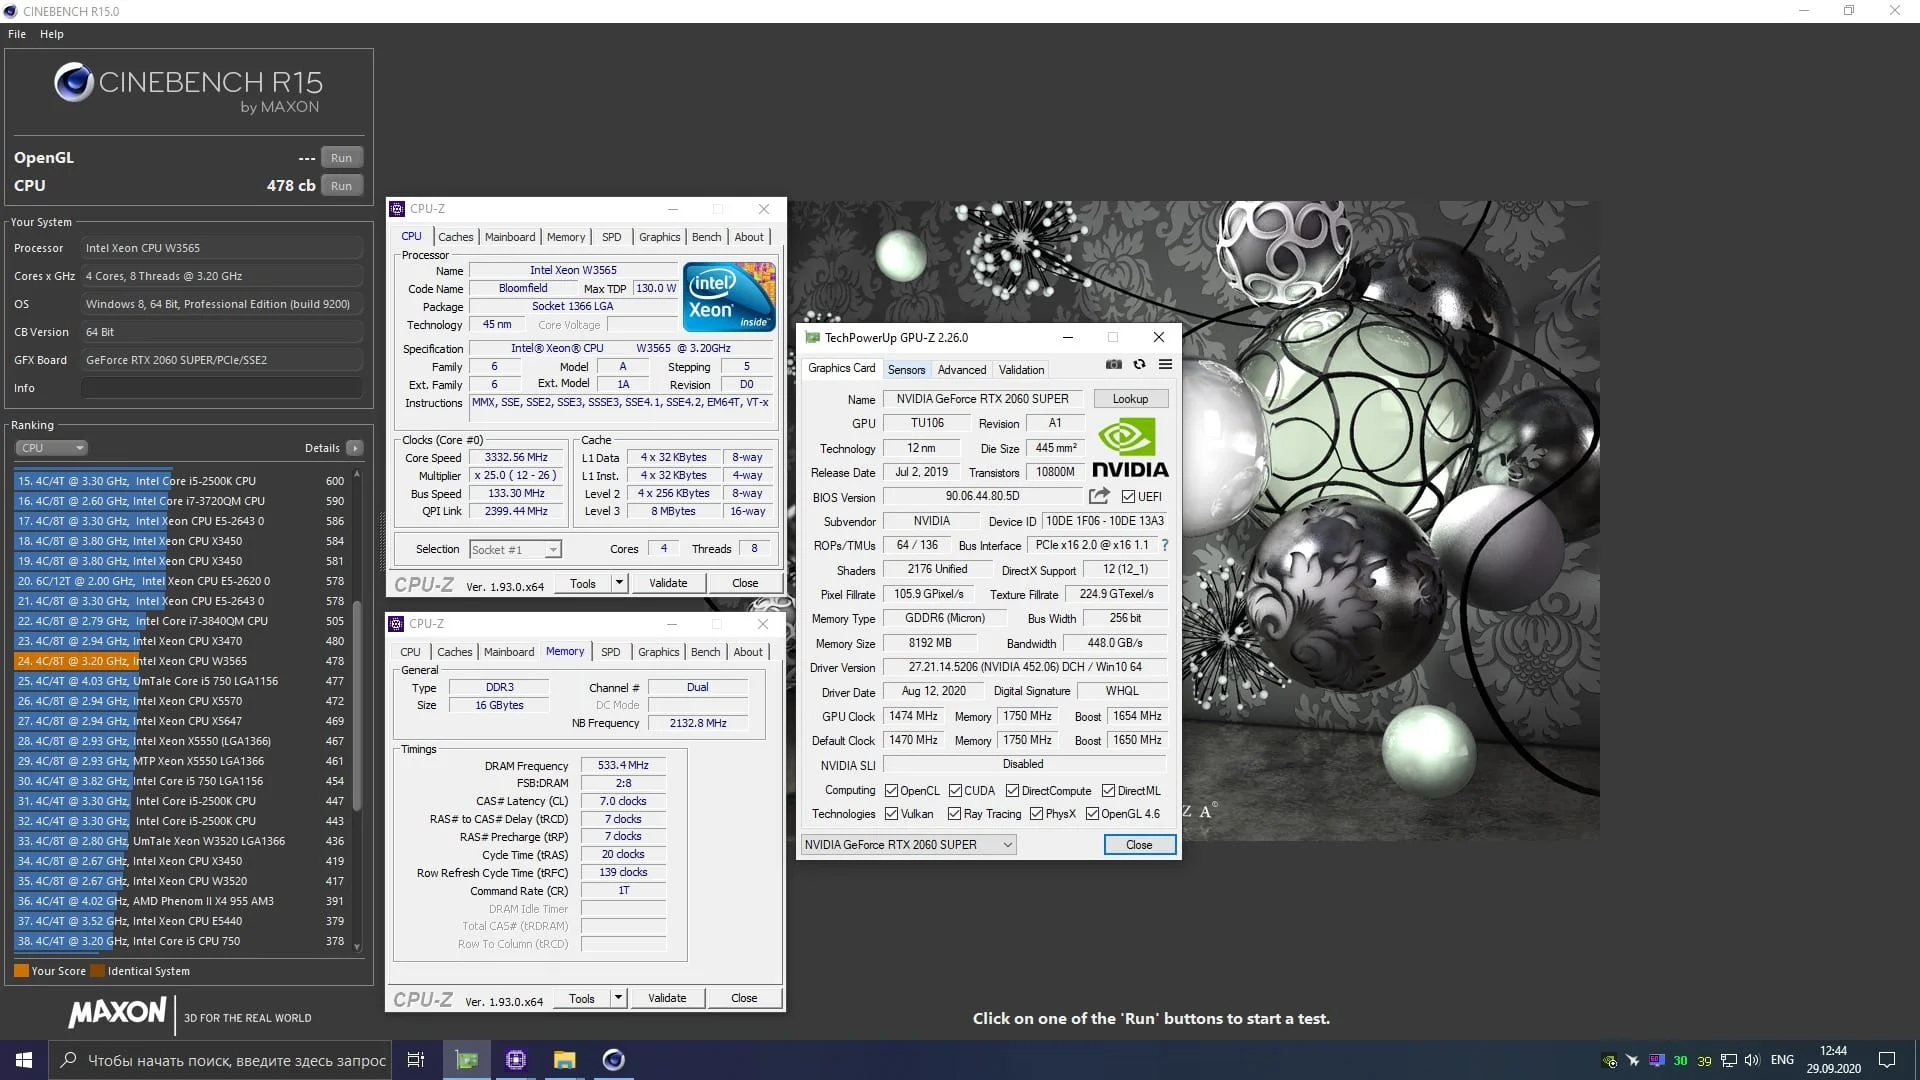 ⤢ ВІДКРИТИ
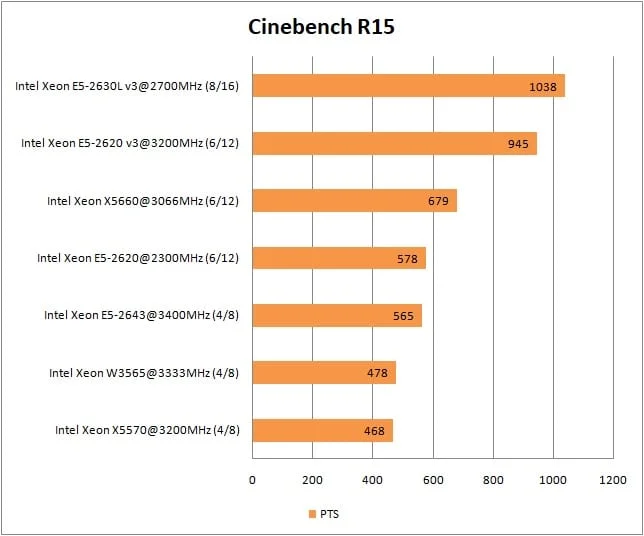 ⤢ ВІДКРИТИ
Cinebench R20
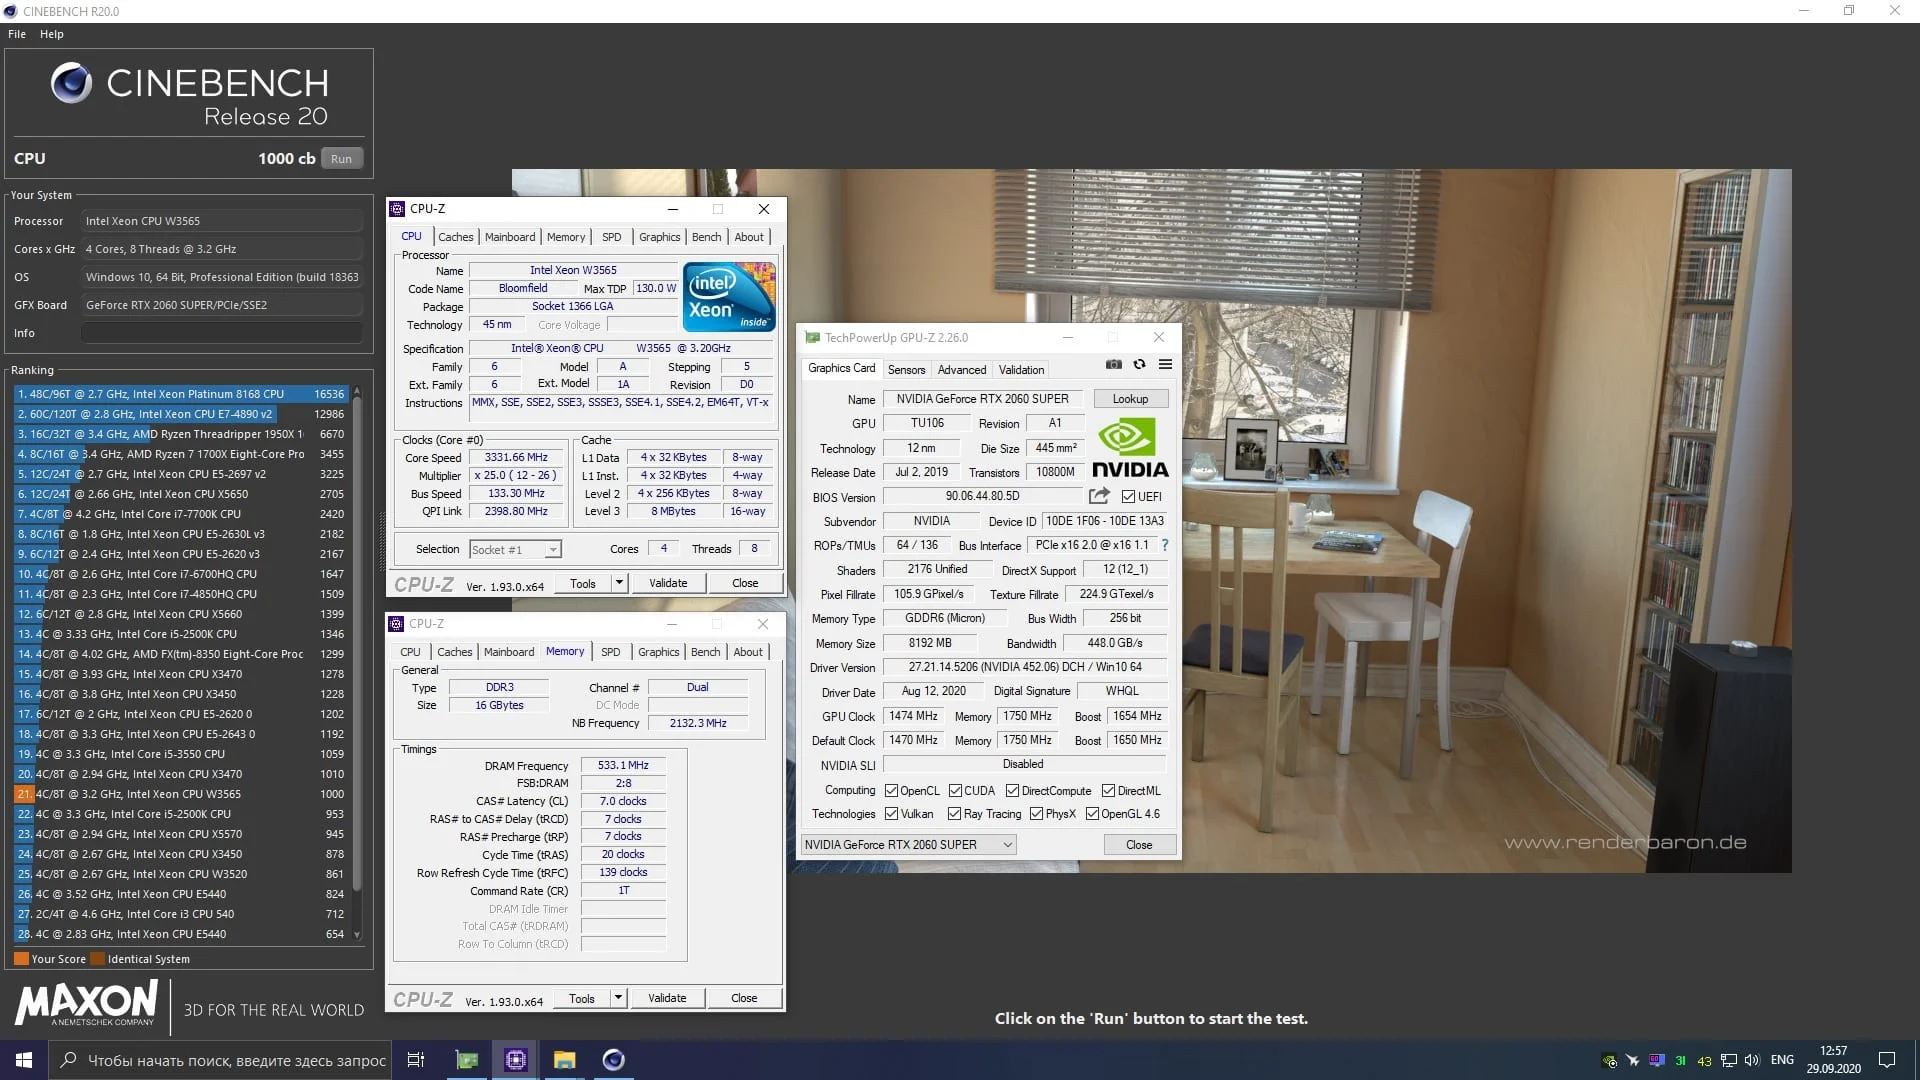 ⤢ ВІДКРИТИ
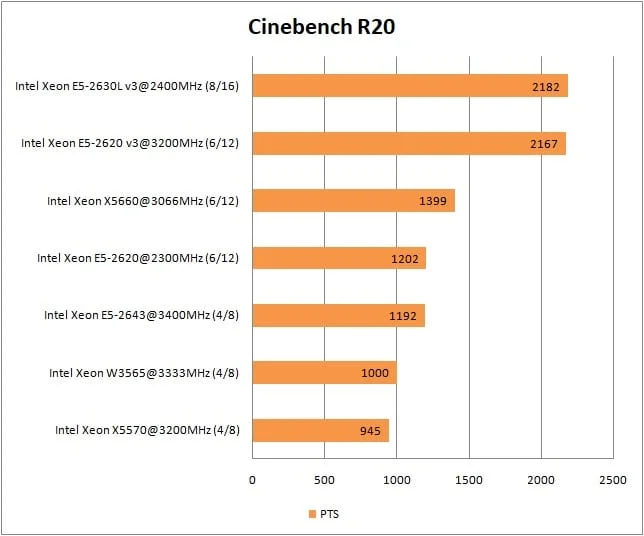 ⤢ ВІДКРИТИ
Corona Render 1.3
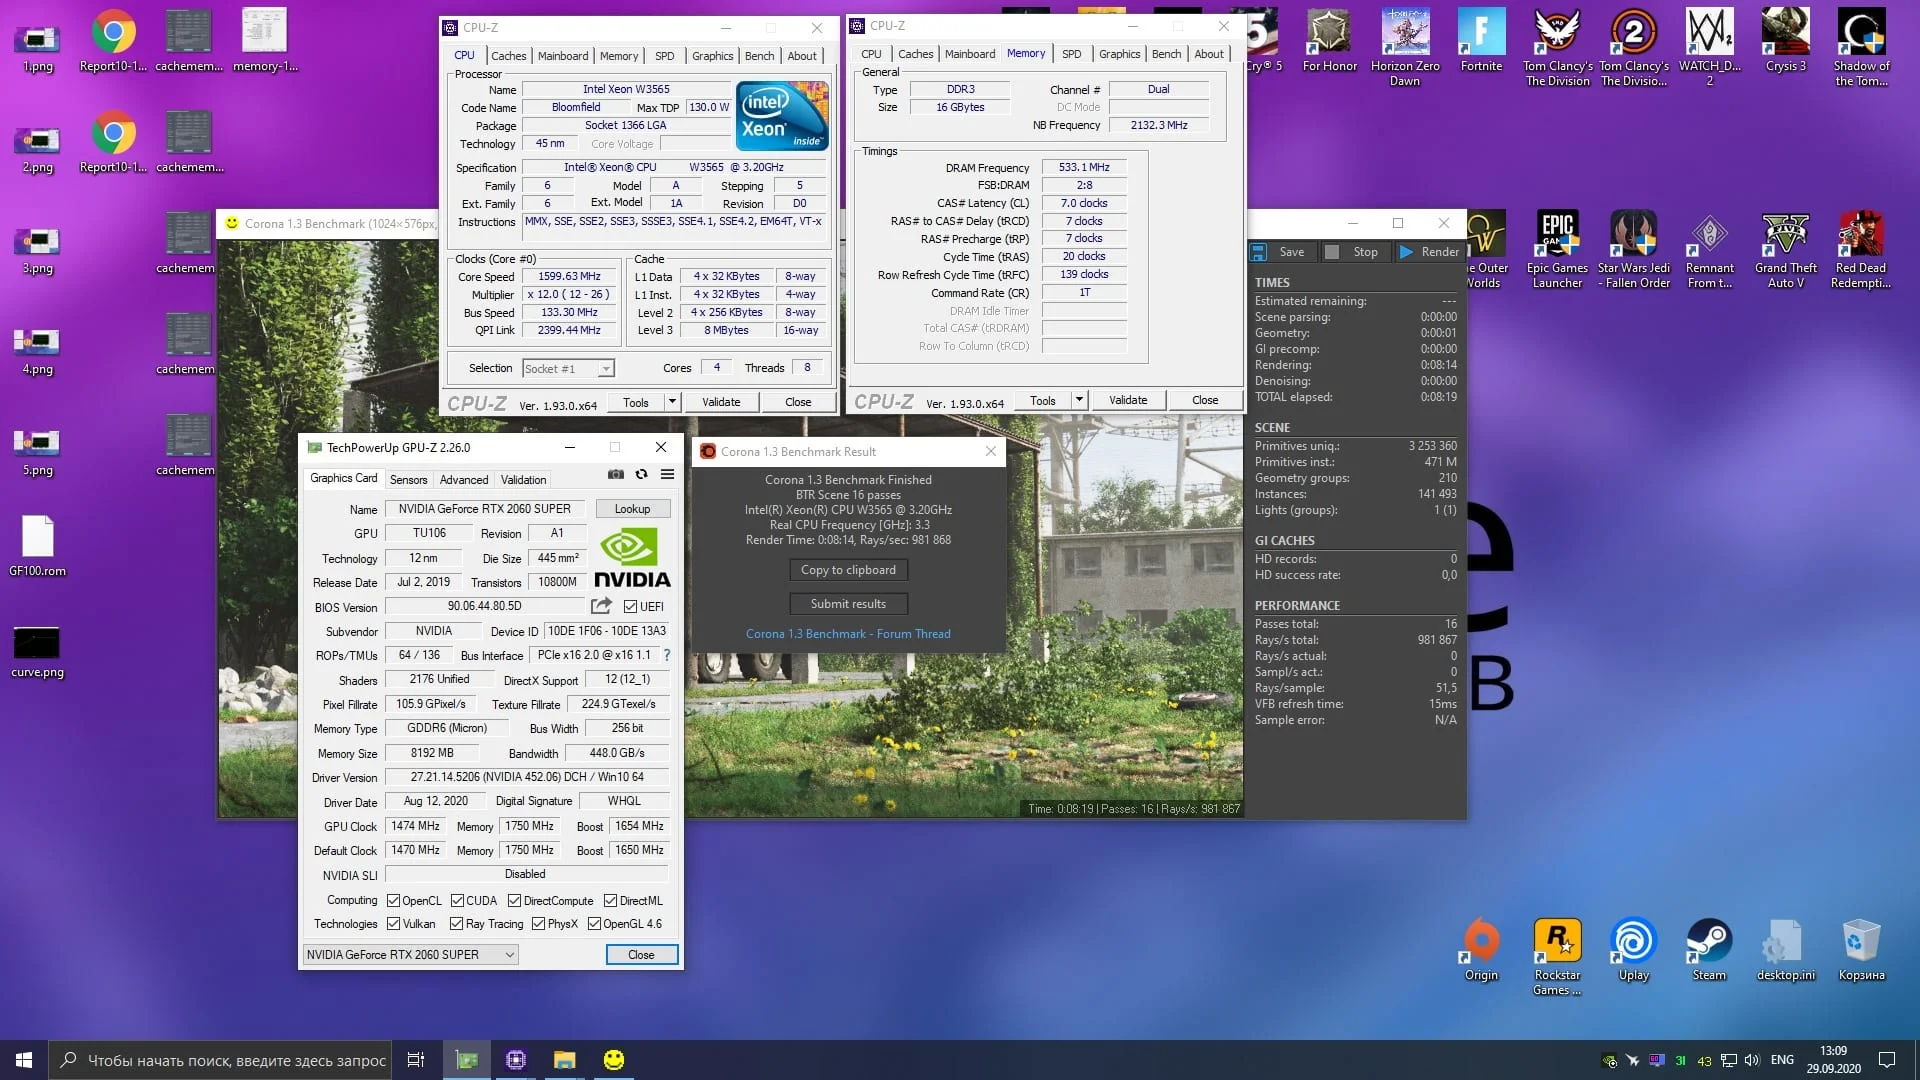 ⤢ ВІДКРИТИ
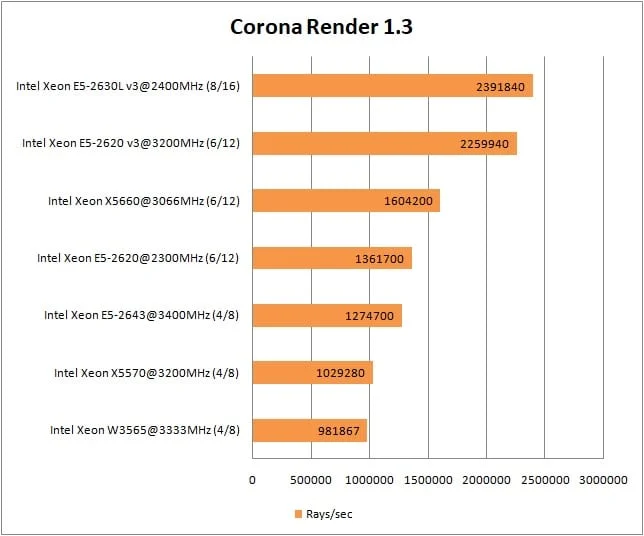 ⤢ ВІДКРИТИ
V-Ray render benchmark
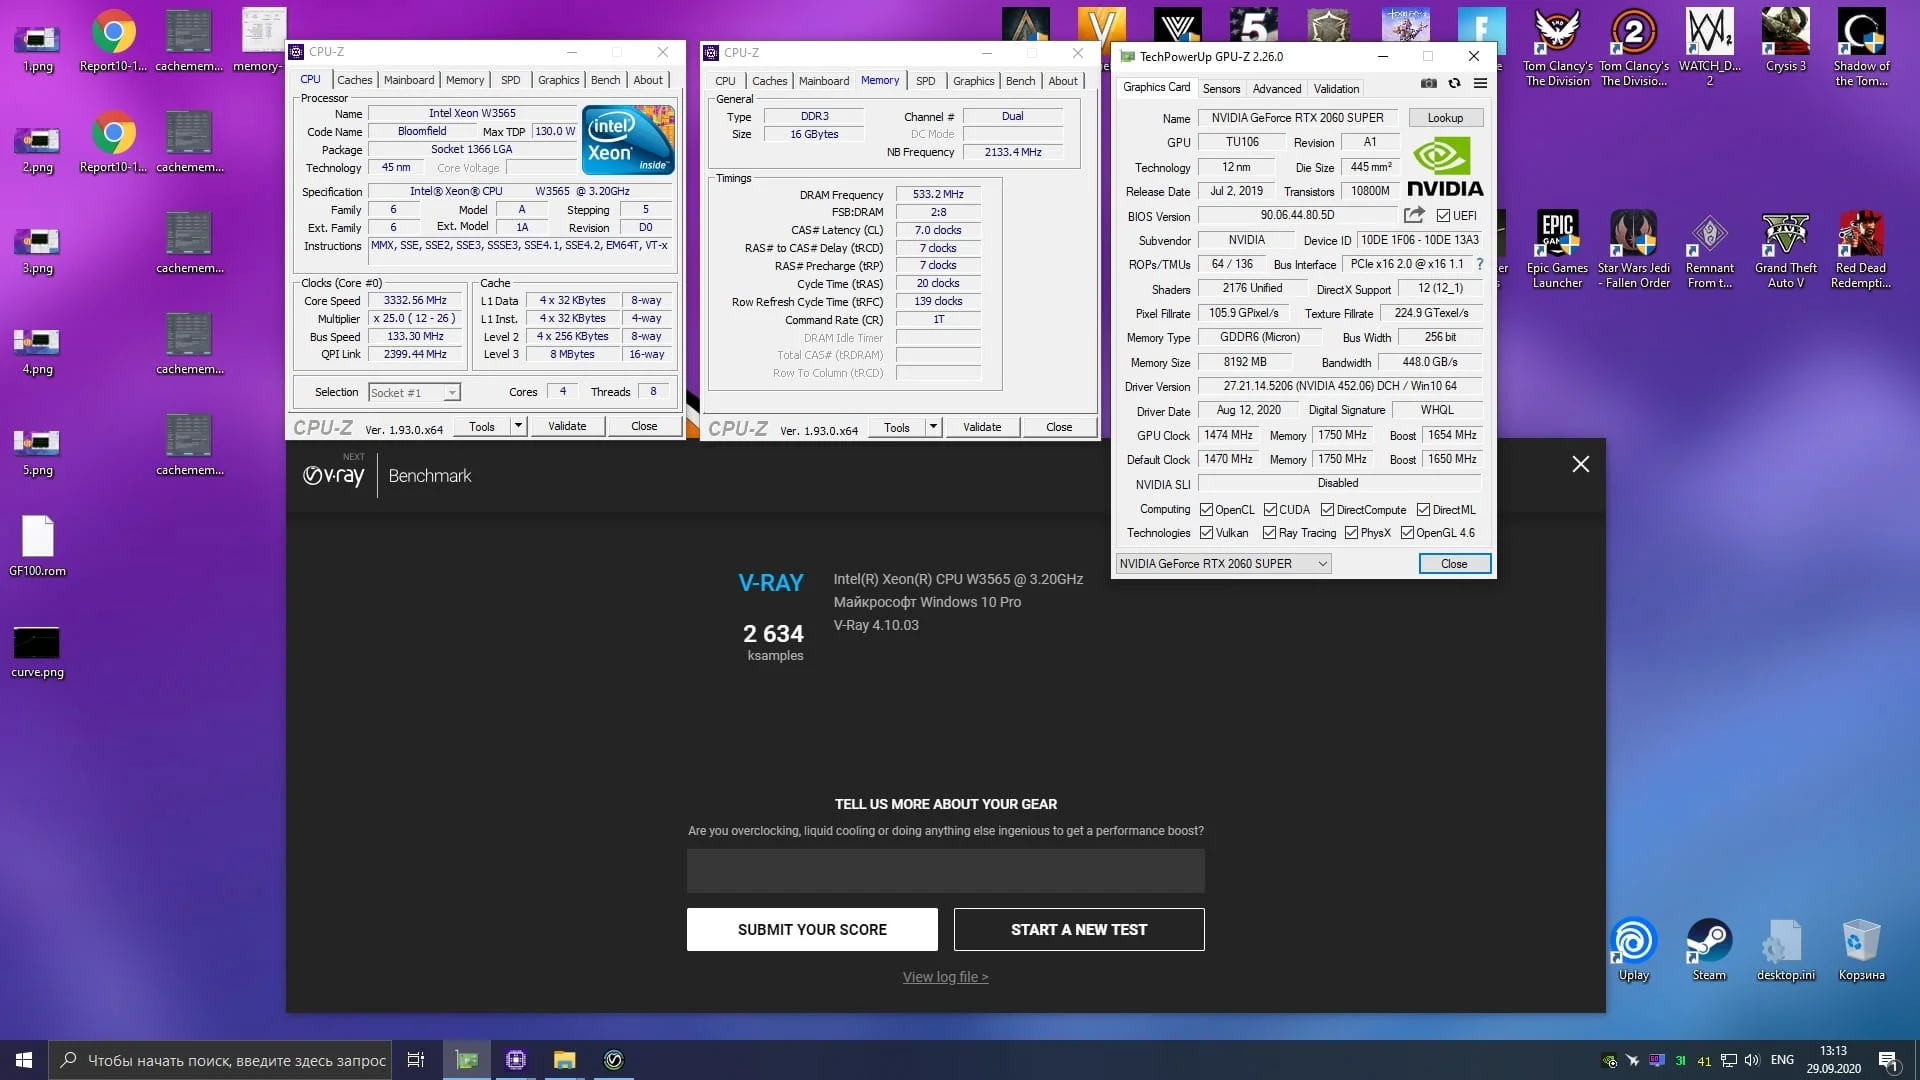 ⤢ ВІДКРИТИ
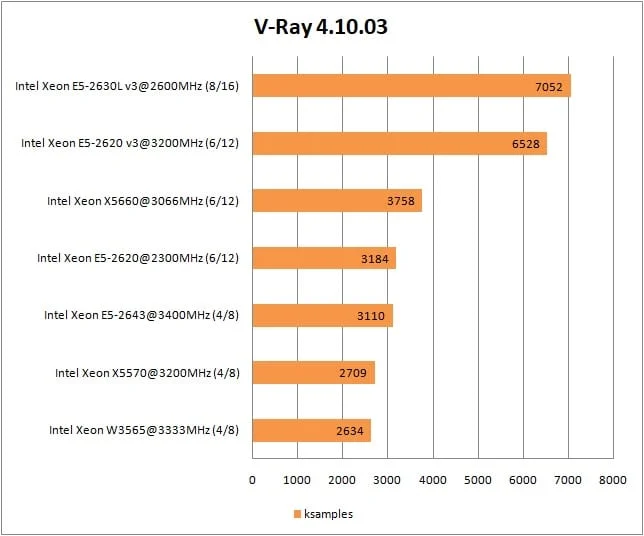 ⤢ ВІДКРИТИ
Real-world rendering:
Blender
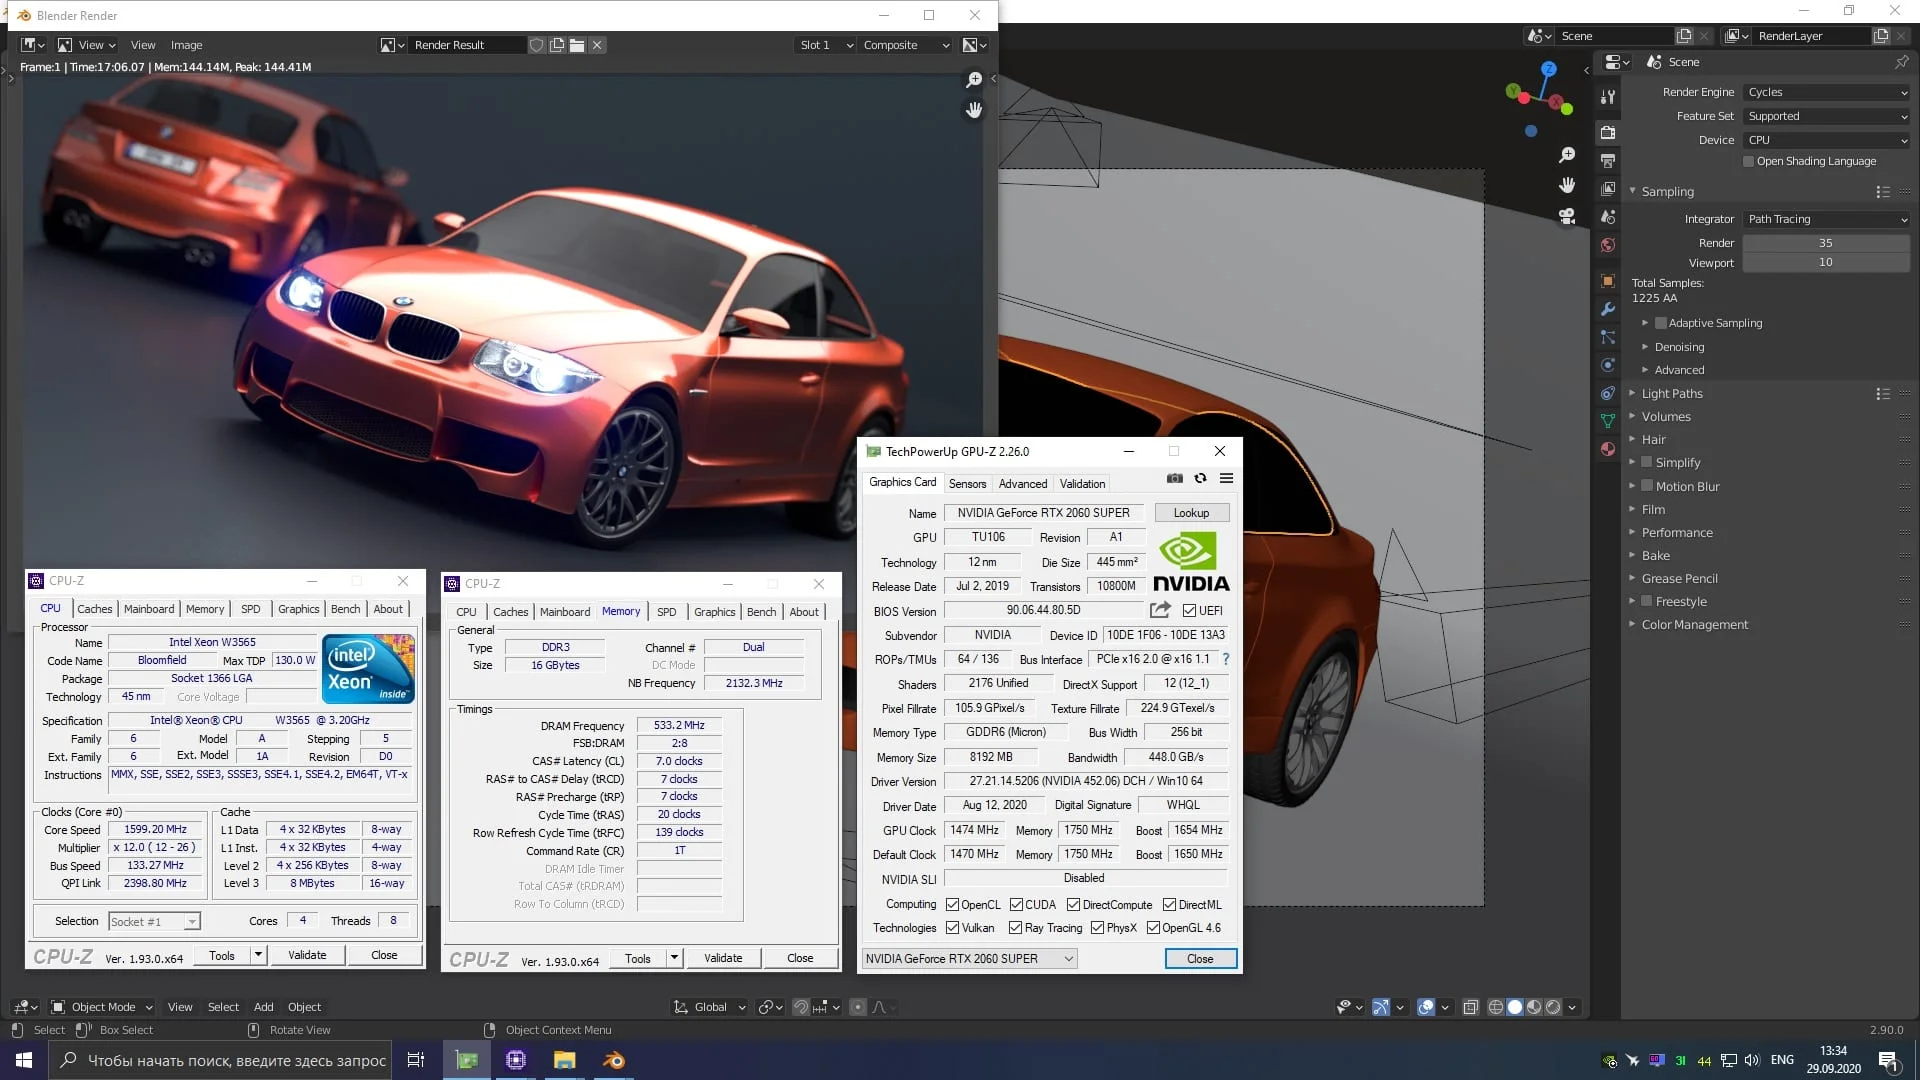 ⤢ ВІДКРИТИ
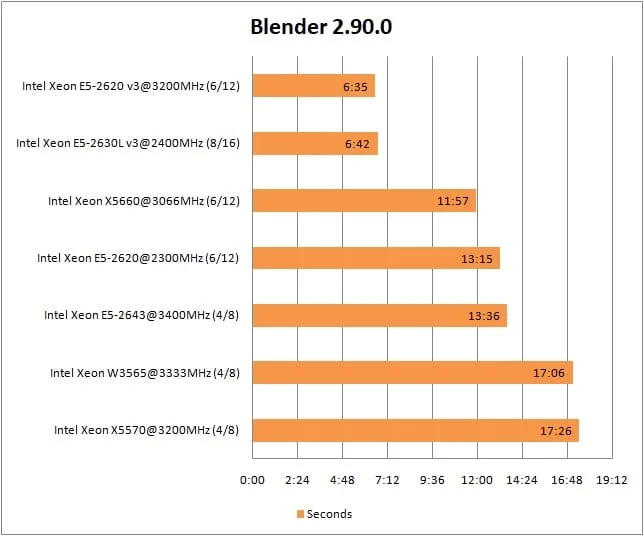 ⤢ ВІДКРИТИ
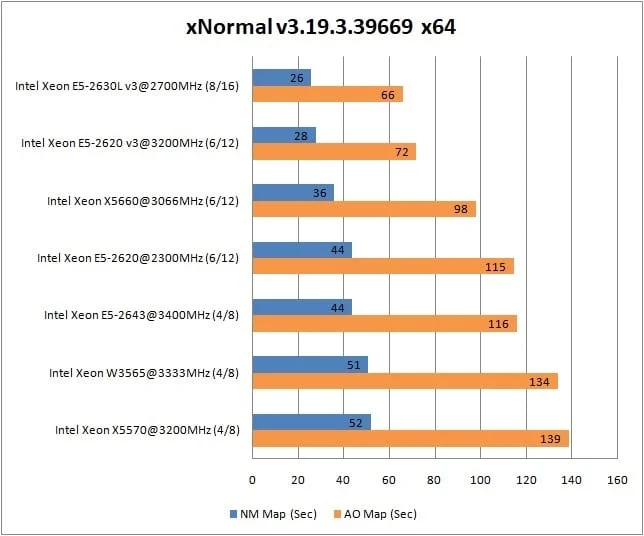
xNormal
 ⤢ ВІДКРИТИ
Video encoding
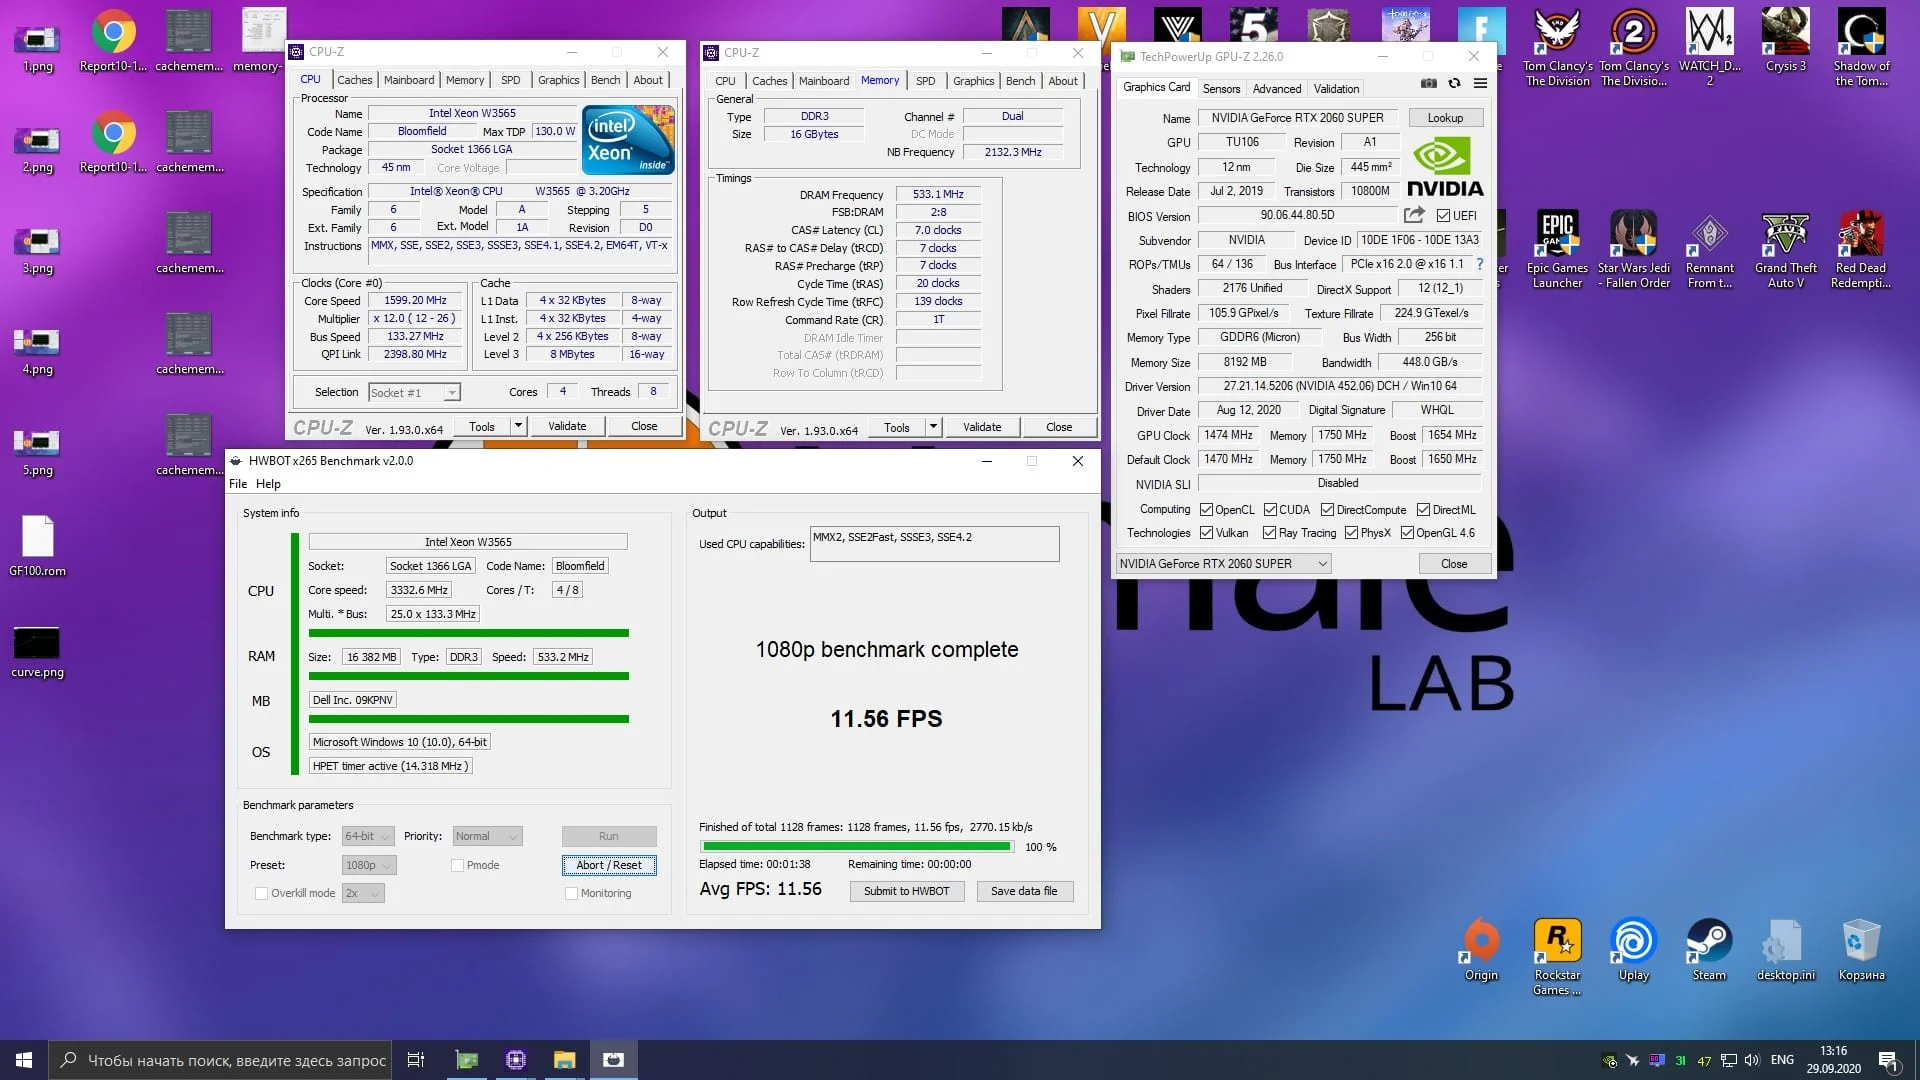
HWBot x265 benchmark, 1080p
 ⤢ ВІДКРИТИ
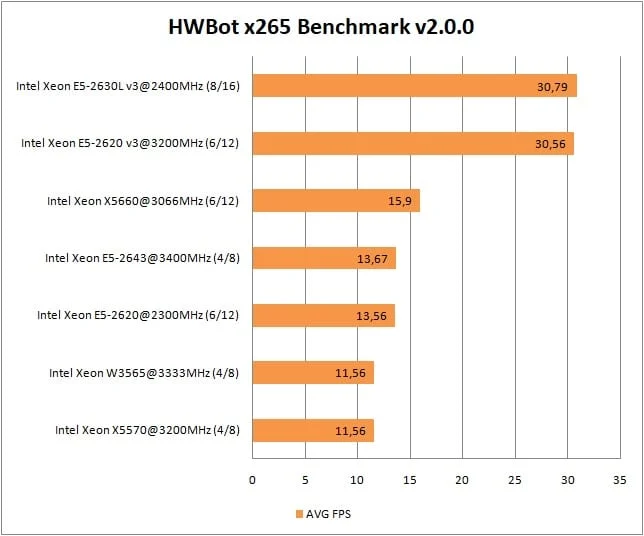 ⤢ ВІДКРИТИ
File compression
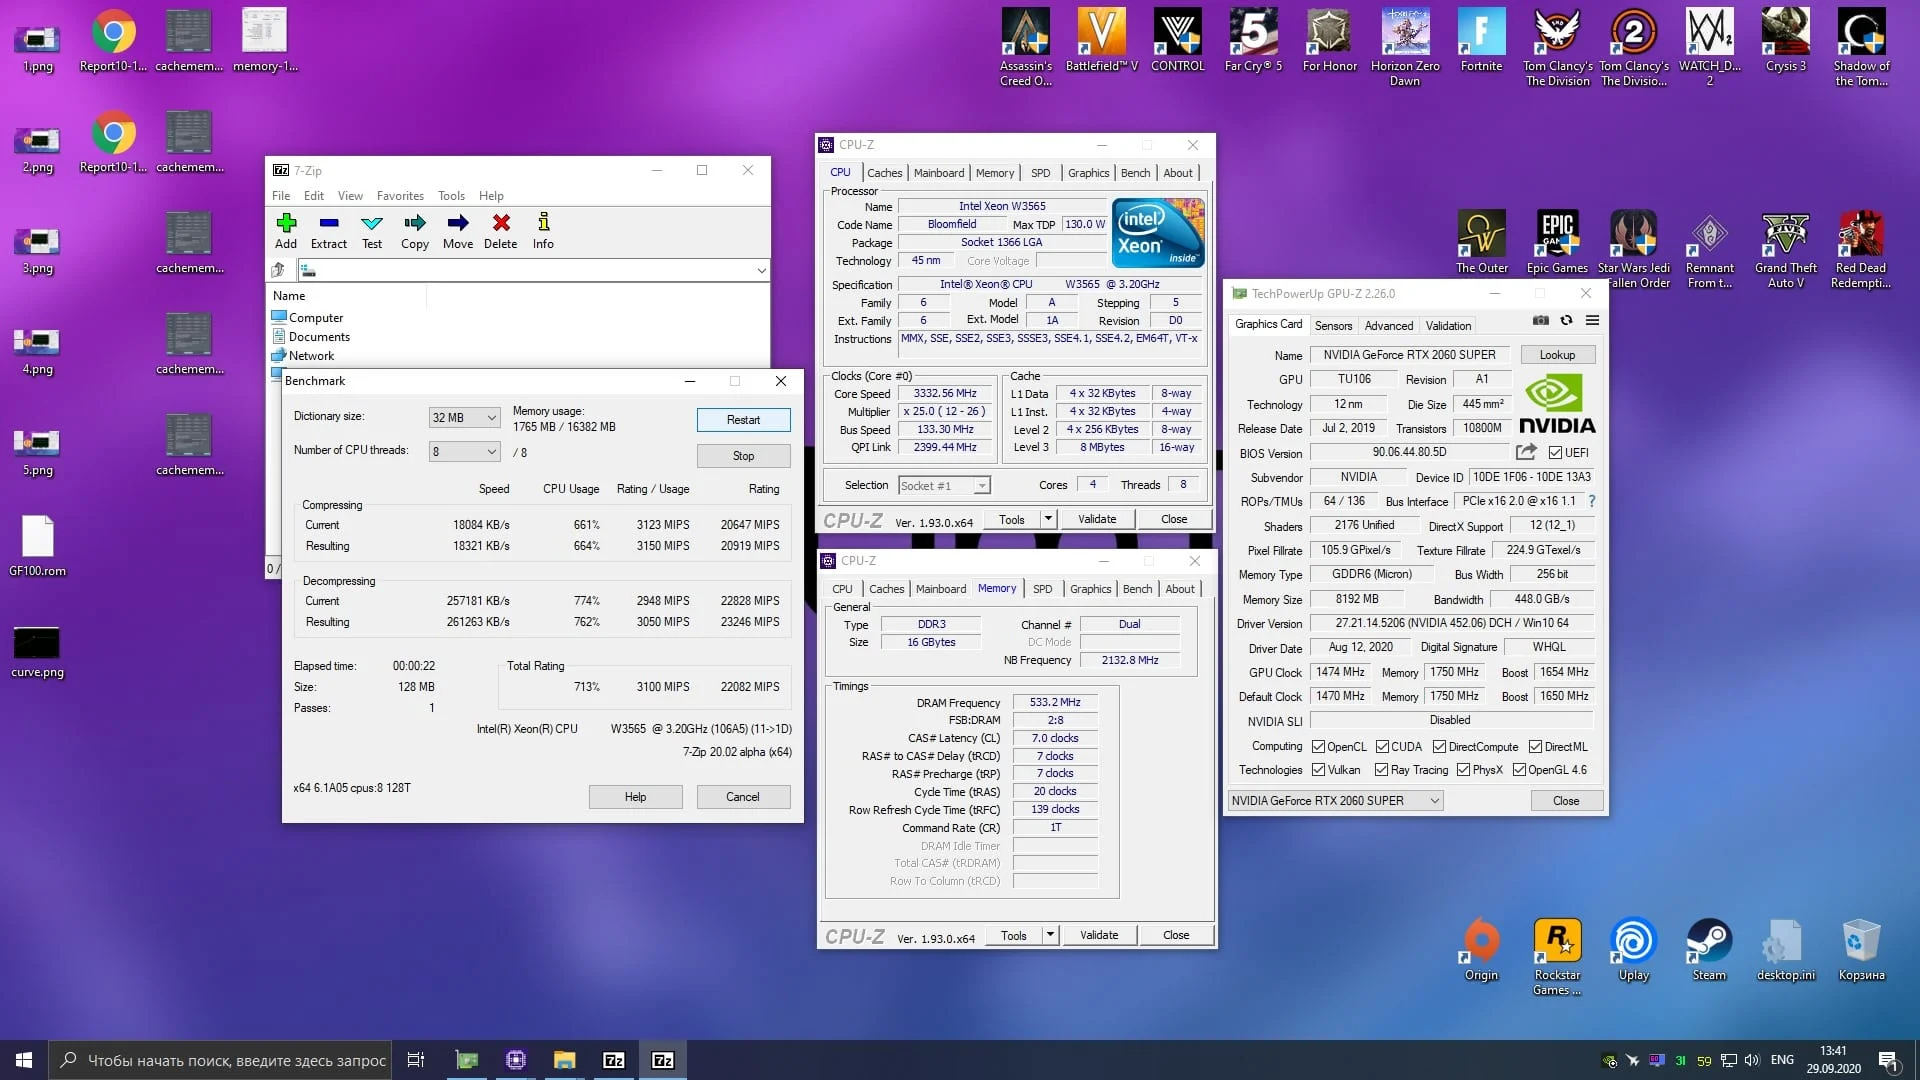
7-Zip
 ⤢ ВІДКРИТИ
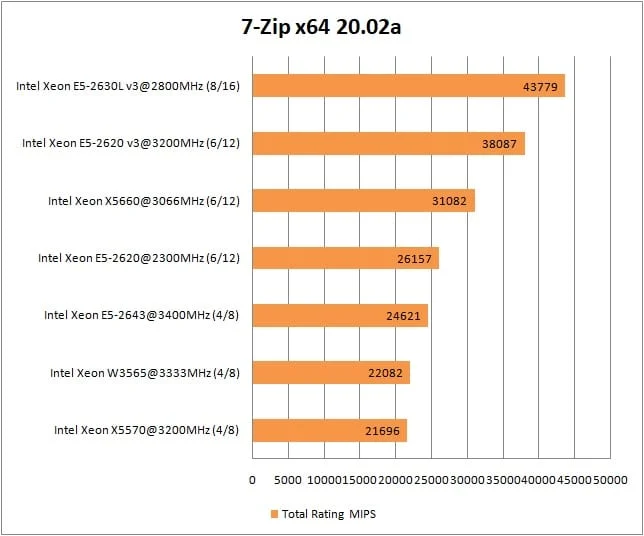 ⤢ ВІДКРИТИ
WinRAR
 ⤢ ВІДКРИТИ
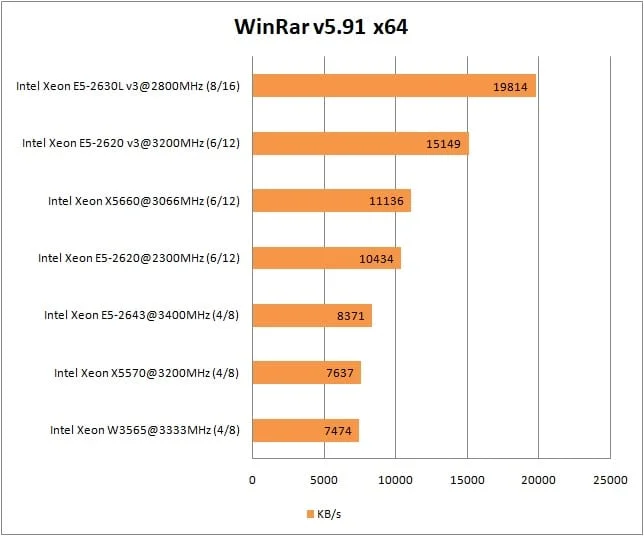 ⤢ ВІДКРИТИ
Tests: | Xeon X5570 | Xeon W3565 |
CPU-Z Benchmark | - | + |
Cinebench R15 | - | + |
Cinebench R20 | - | + |
Corona Render 1.3 | + | - |
V-Ray Render Benchmark | + | - |
Blender | - | + |
xNormal | - | + |
HWBot x265 Benchmark, 1080P | ~ | ~ |
7-Zip | - | + |
WinRAR | + | - |
So, the W3565 won in 6 out of 10 software tests, losing in just 4. However, when we look at real-world workloads instead of synthetic benchmarks, it's a dead heat between the X5570 and W3565. The X5570 pulls ahead in Corona Render 1.3, V-Ray, and WinRAR, while the W3565 takes the lead in Blender, xNormal, and 7-Zip. Even more interesting, both CPUs delivered identical FPS in the HWBot x265 1080p benchmark.
That wraps up our software tests. Now let's dive into the gaming performance of the W3565. Spoiler alert: the results here are almost the exact opposite. Game engines are highly sensitive to L3 cache and RAM speeds, so the W3565's fate was pretty much sealed from the start.
Gaming benchmarks
Assassin’s Creed Odyssey
 ⤢ ВІДКРИТИ
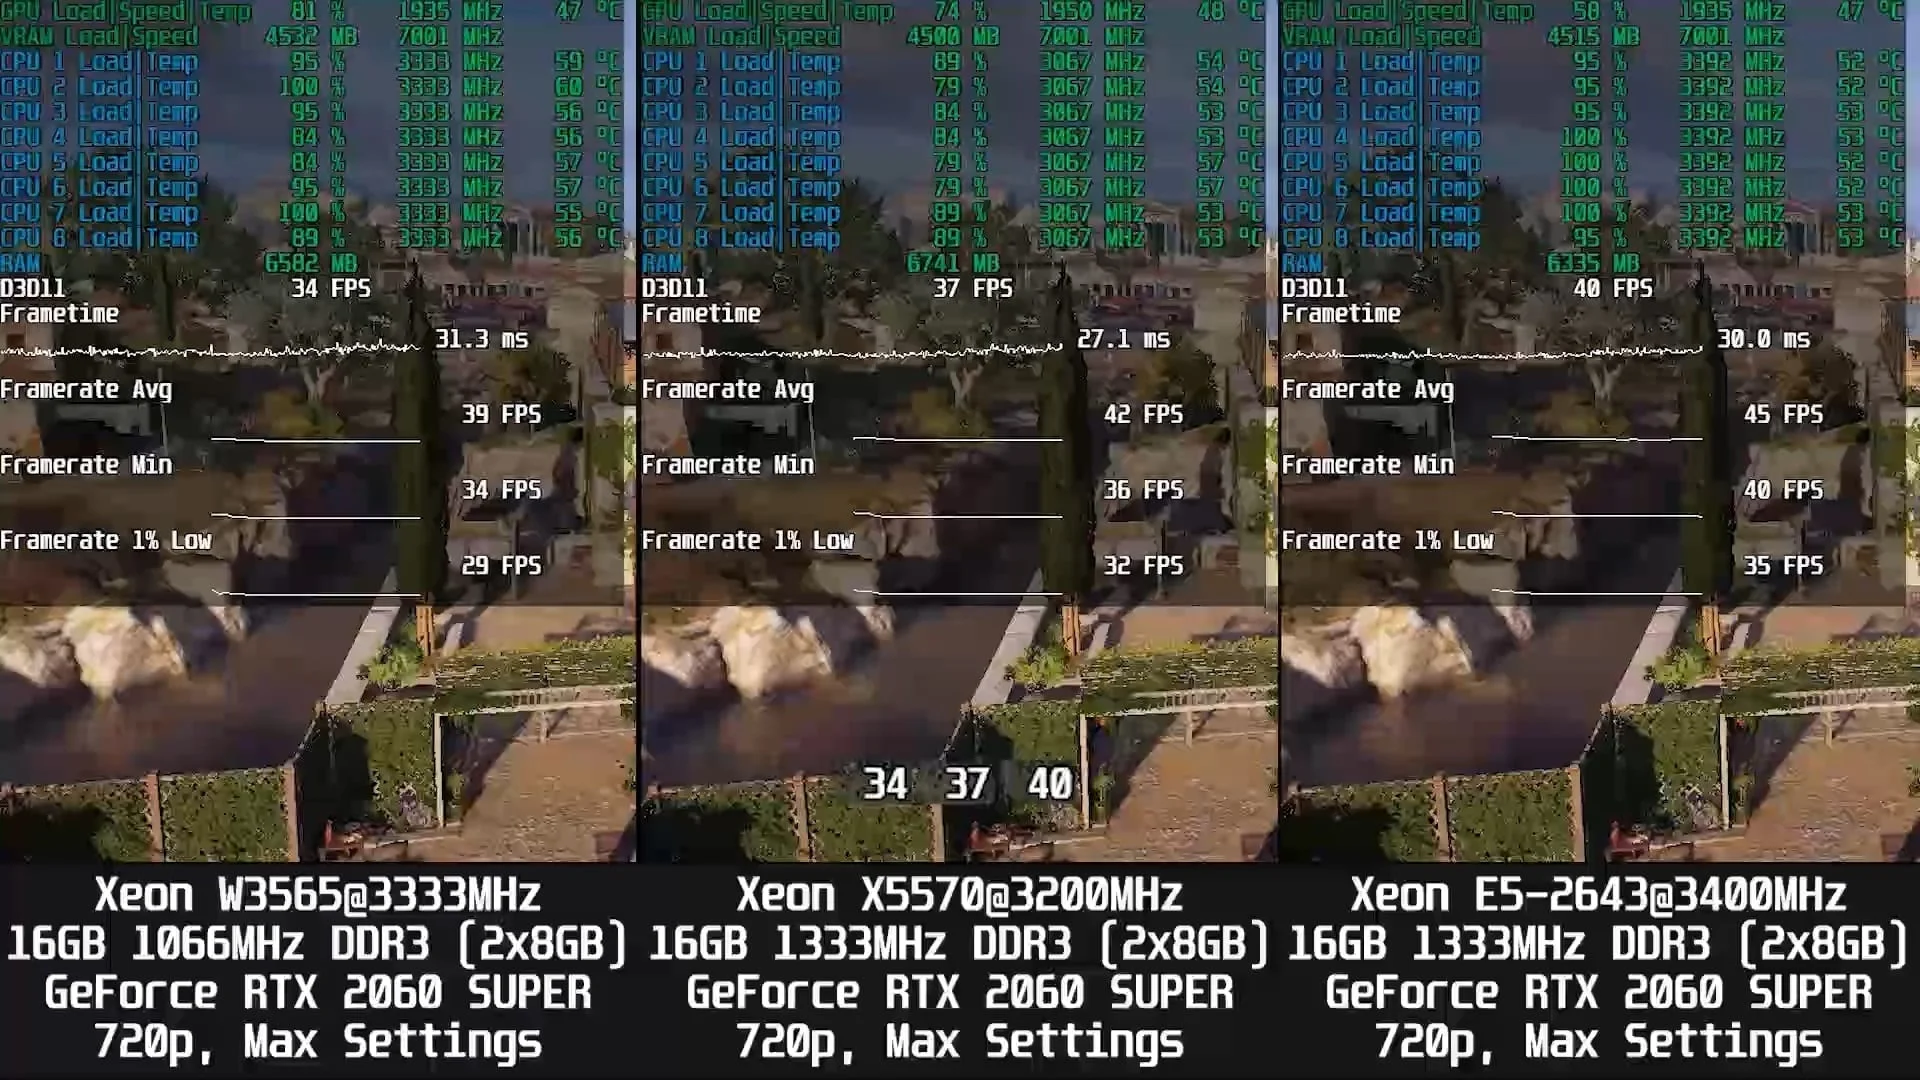 ⤢ ВІДКРИТИ
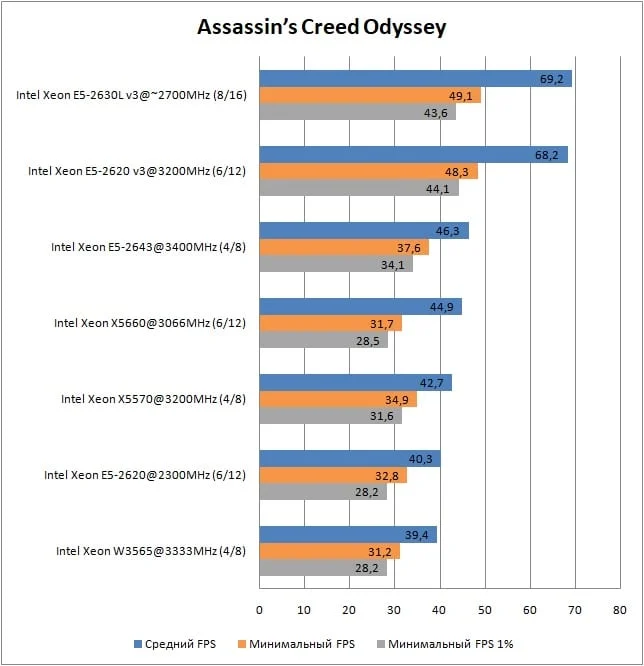 ⤢ ВІДКРИТИ
Battlefield V
 ⤢ ВІДКРИТИ
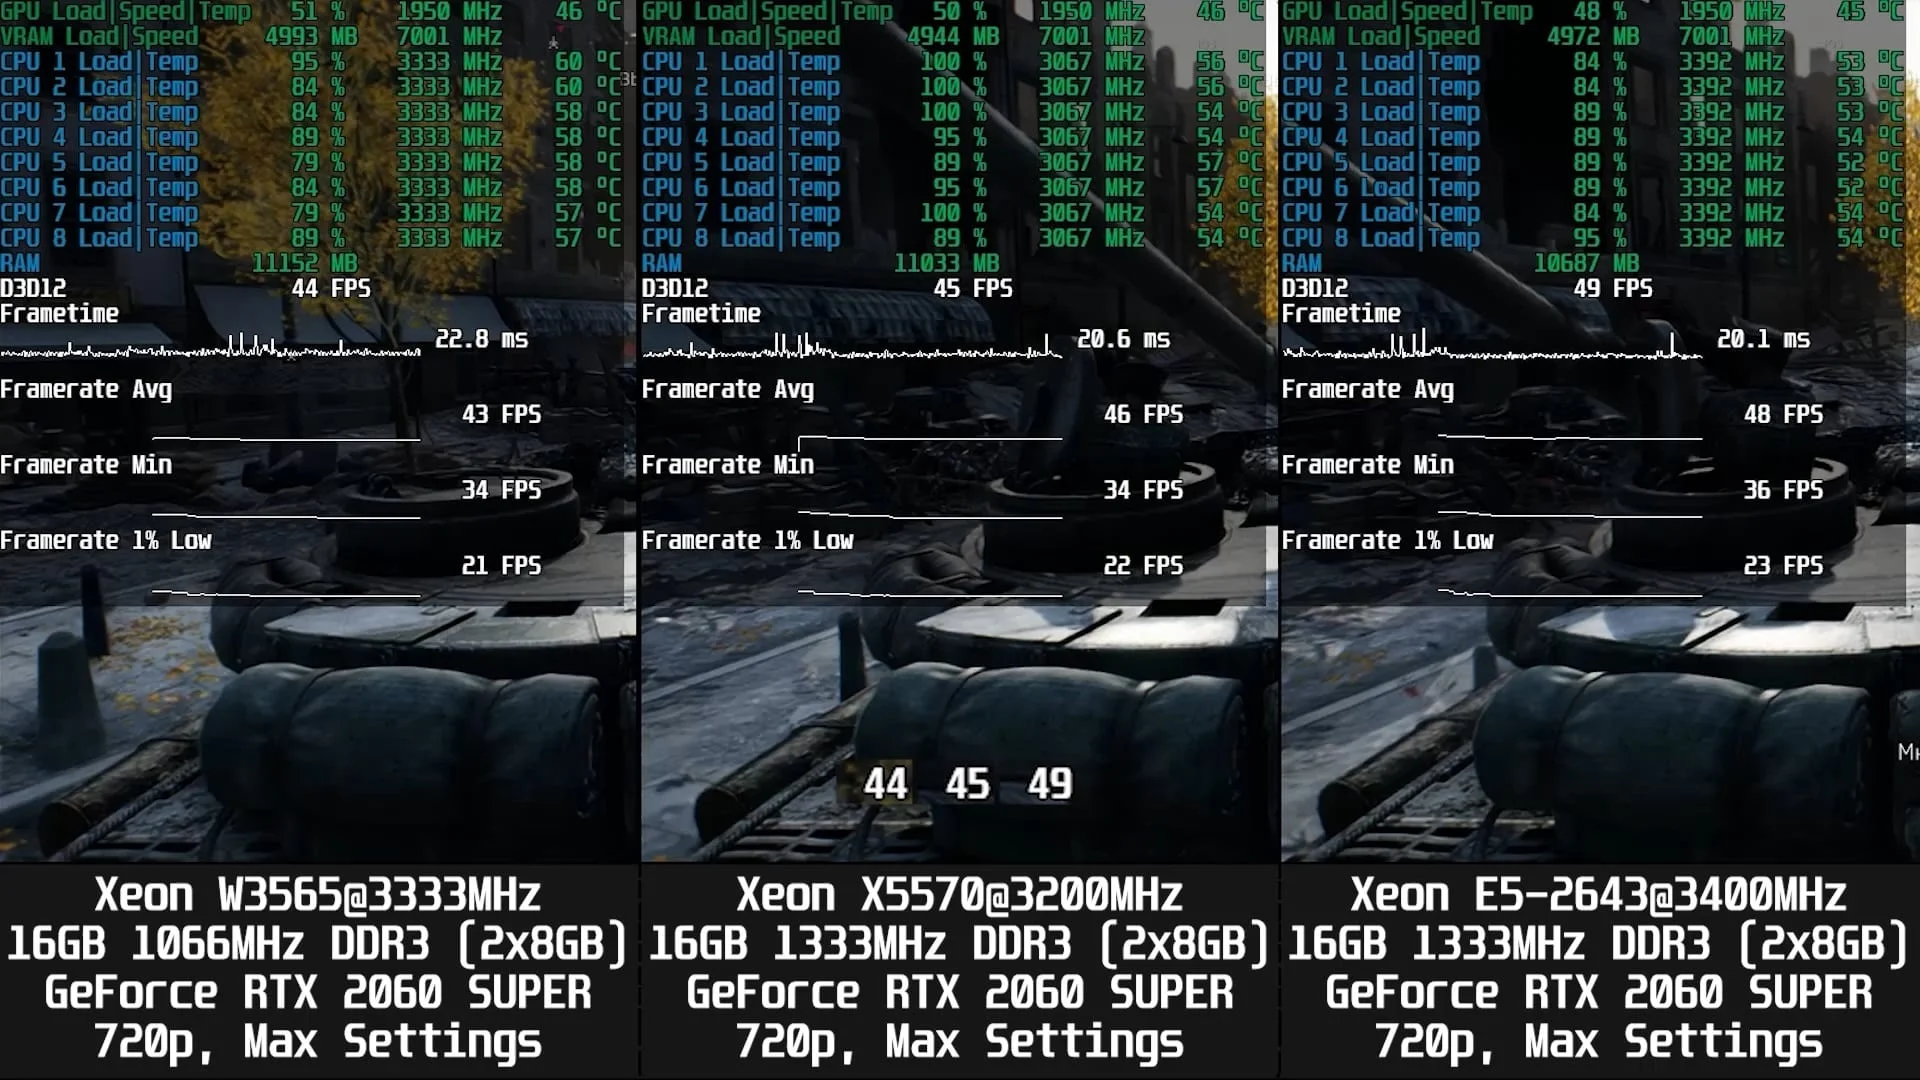 ⤢ ВІДКРИТИ
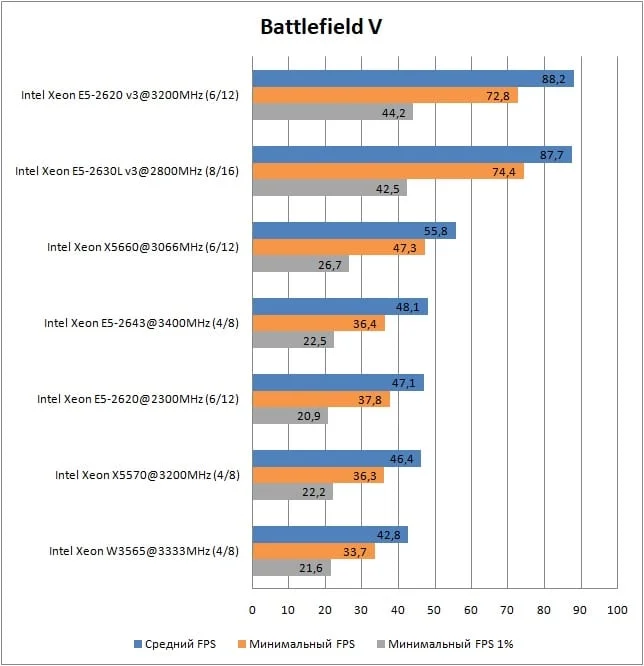 ⤢ ВІДКРИТИ
Control Ultimate Edition
 ⤢ ВІДКРИТИ
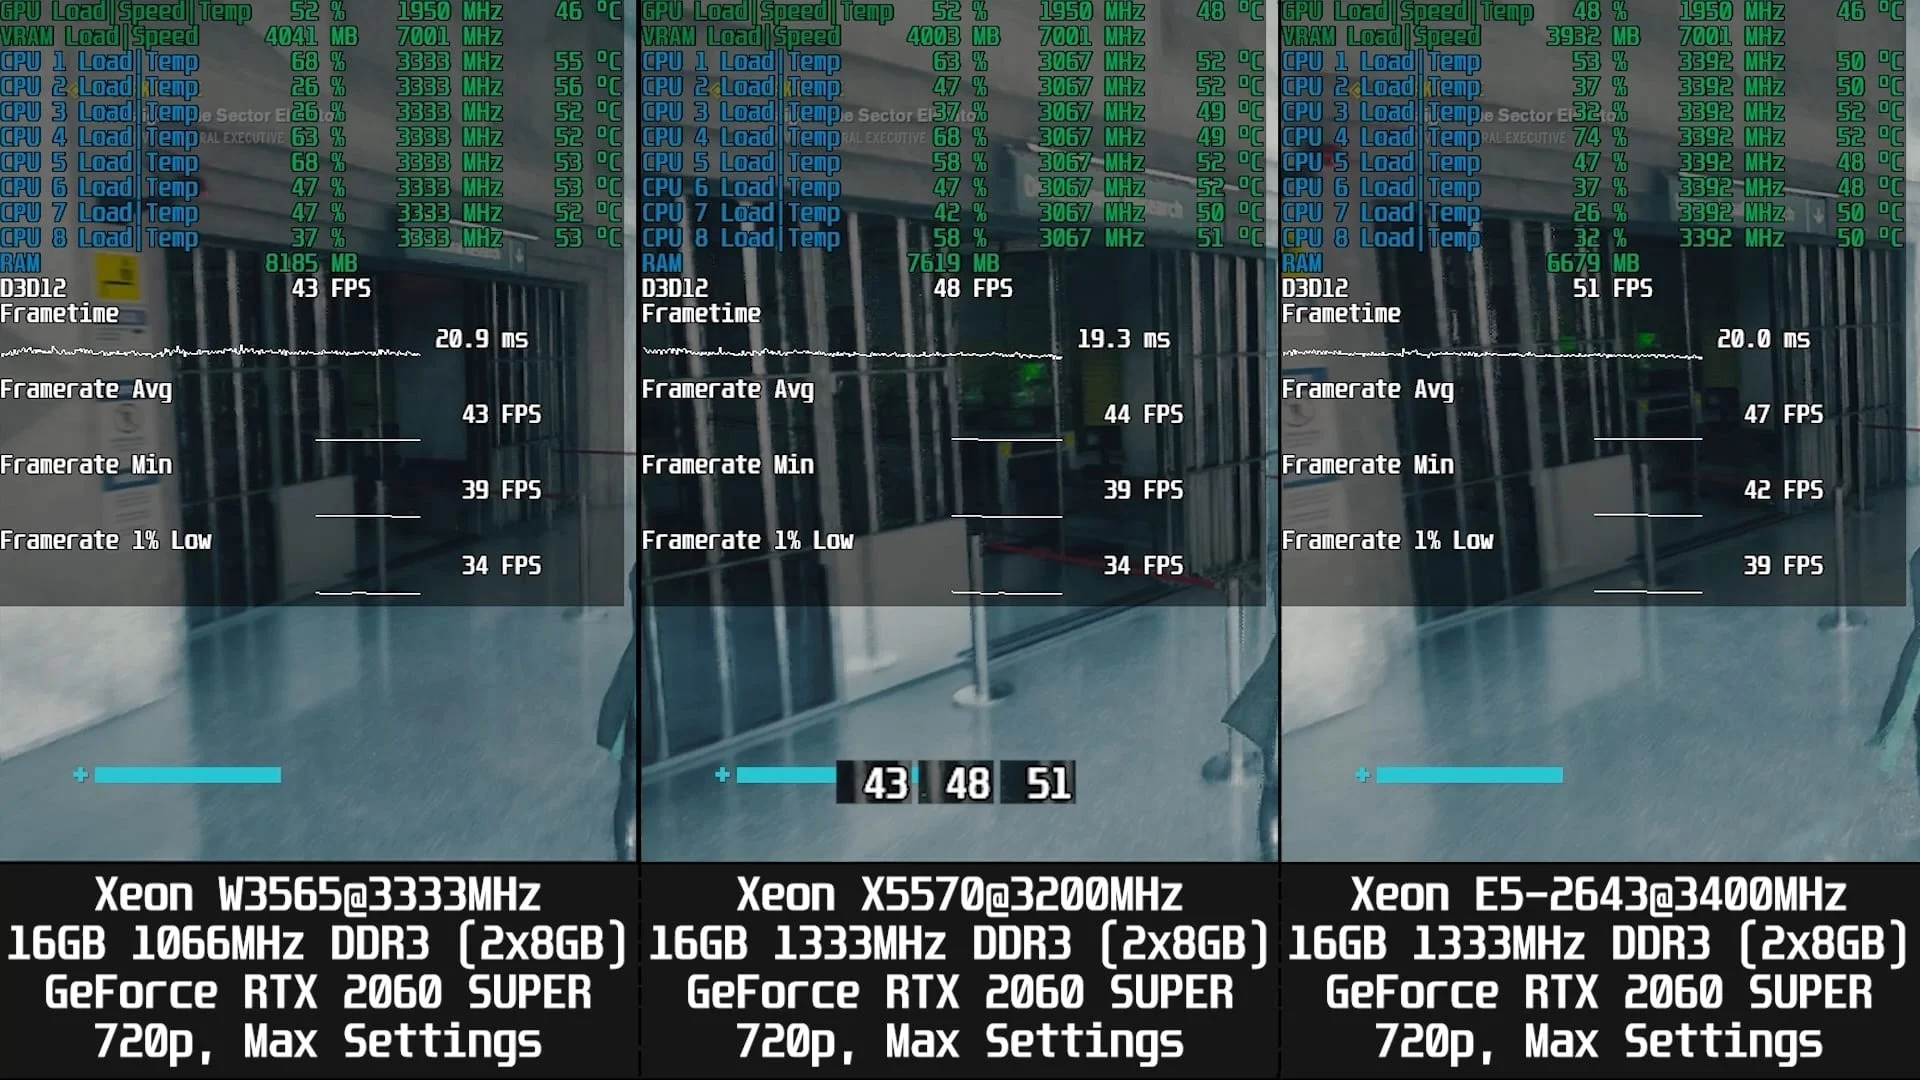 ⤢ ВІДКРИТИ
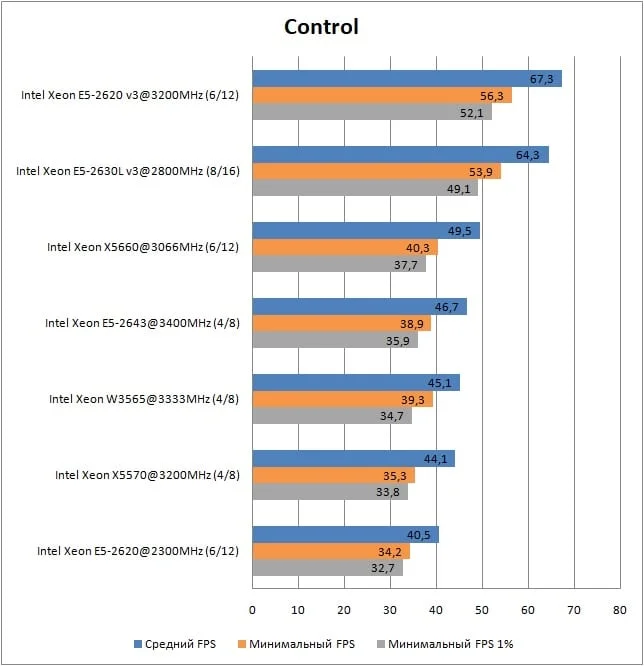 ⤢ ВІДКРИТИ
Counter-Strike: Global Offensive
 ⤢ ВІДКРИТИ
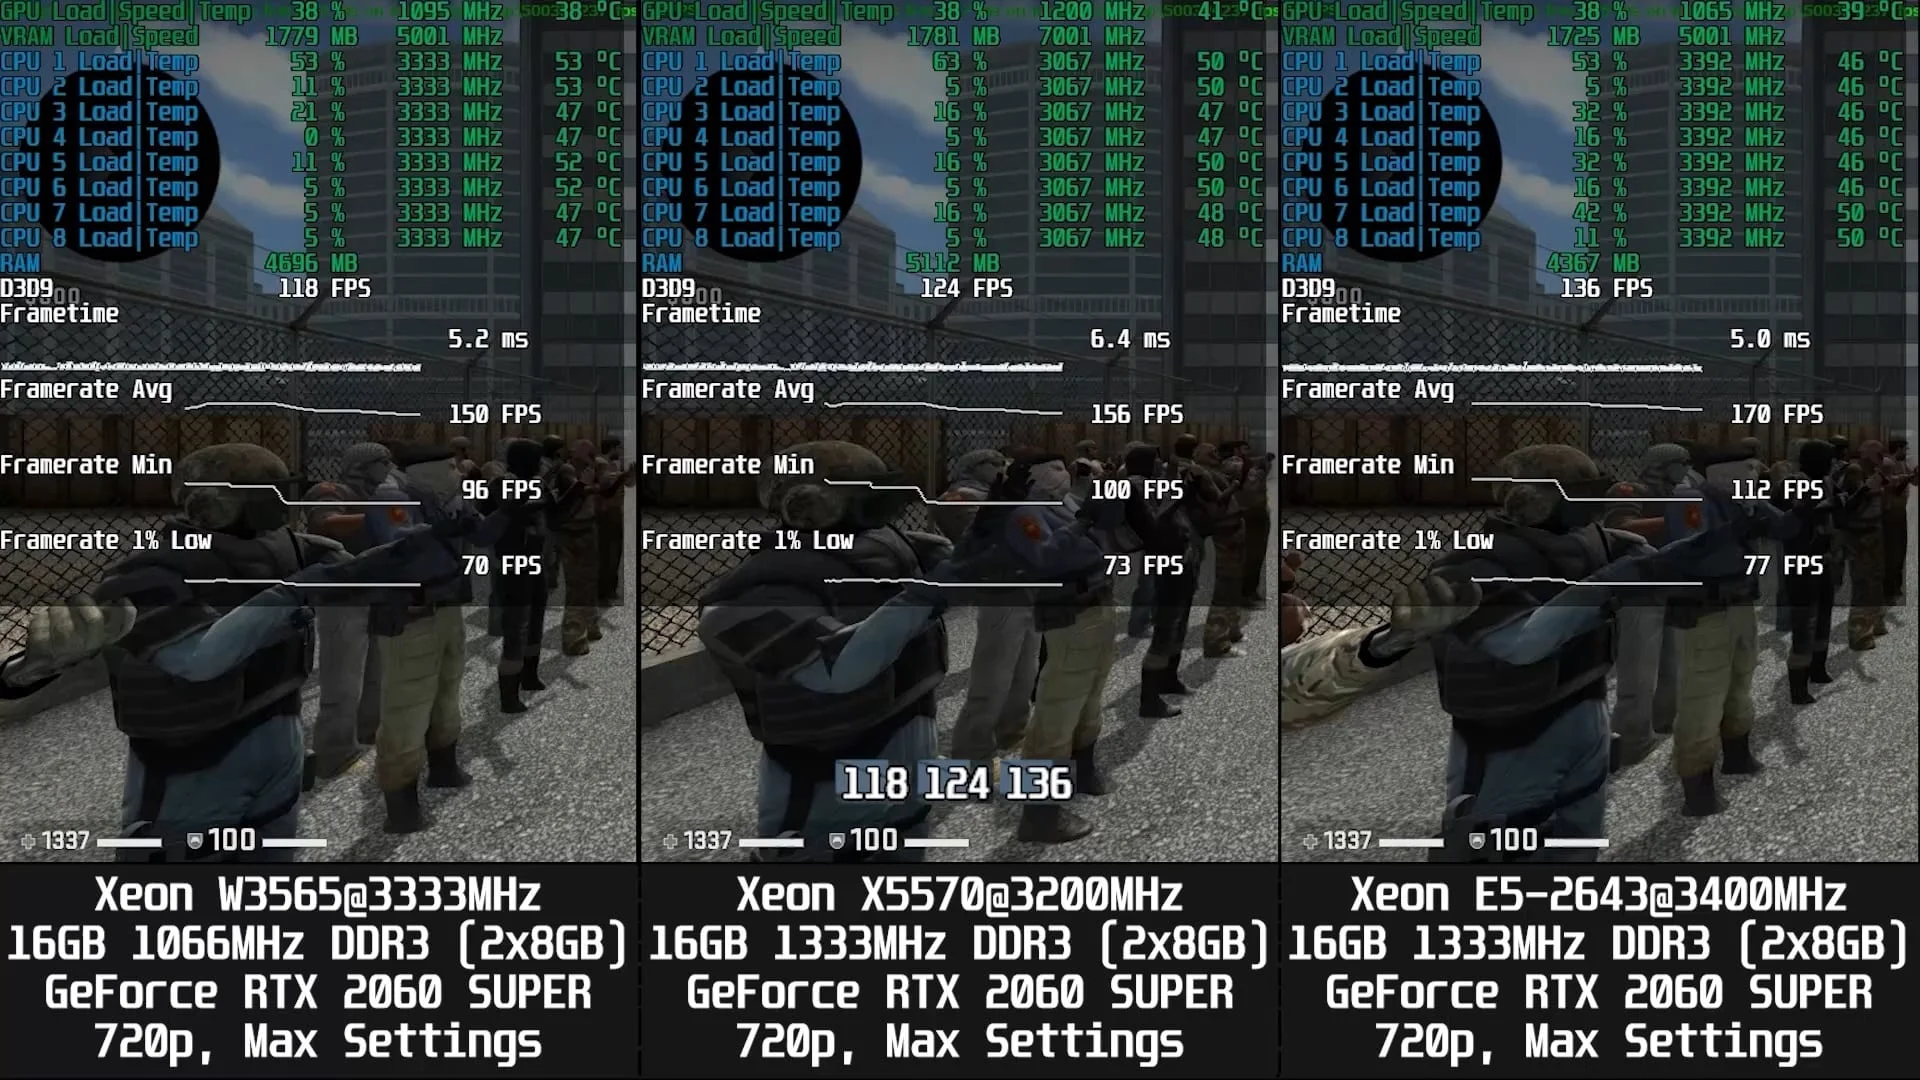 ⤢ ВІДКРИТИ
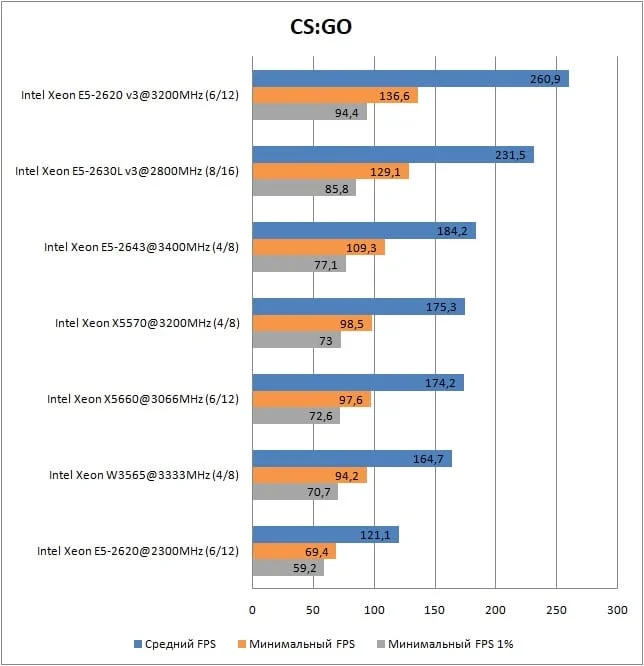 ⤢ ВІДКРИТИ
Destiny 2
 ⤢ ВІДКРИТИ
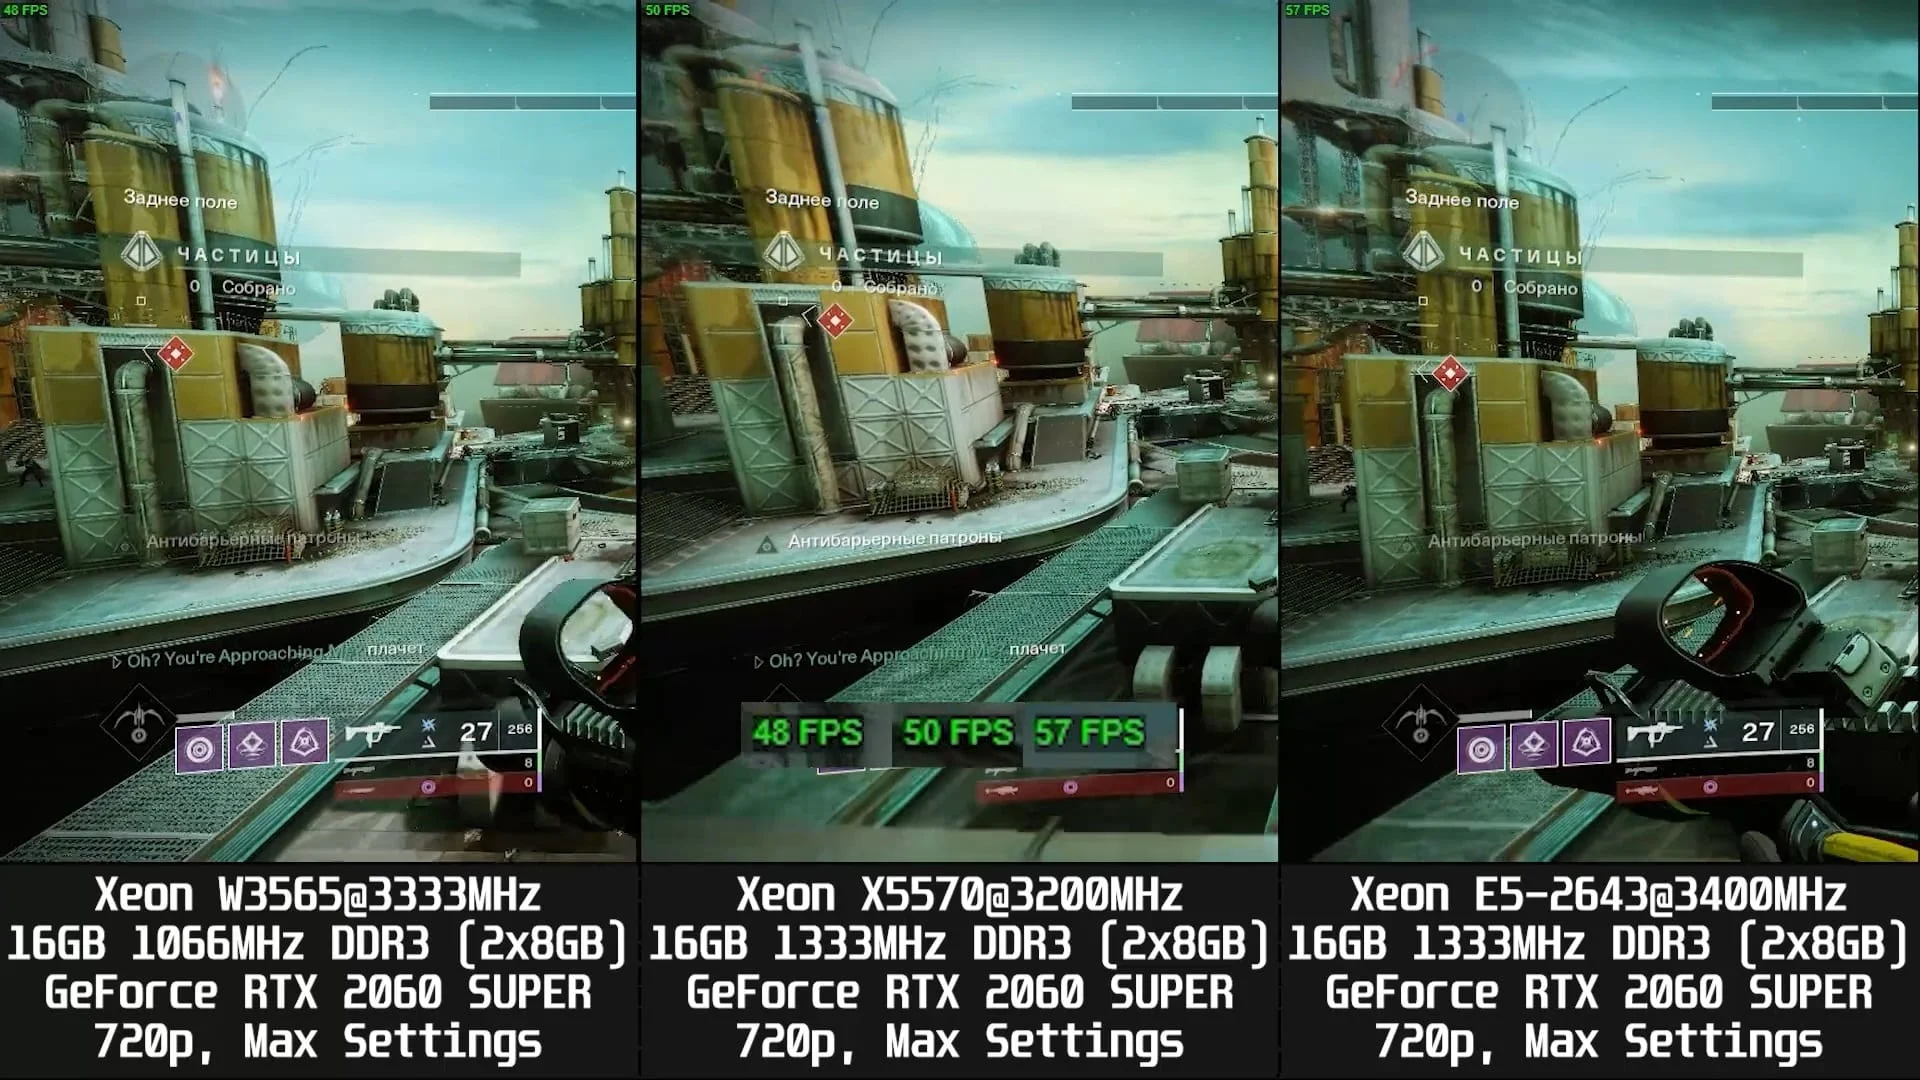 ⤢ ВІДКРИТИ
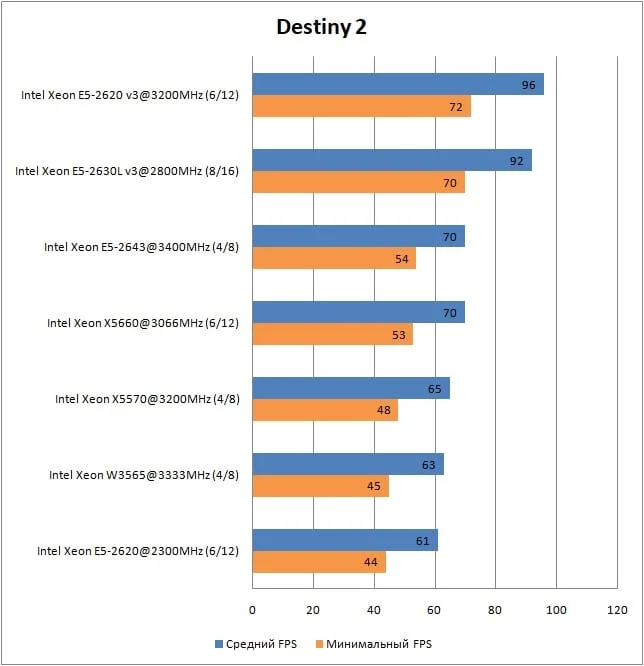 ⤢ ВІДКРИТИ
Far Cry 5
 ⤢ ВІДКРИТИ
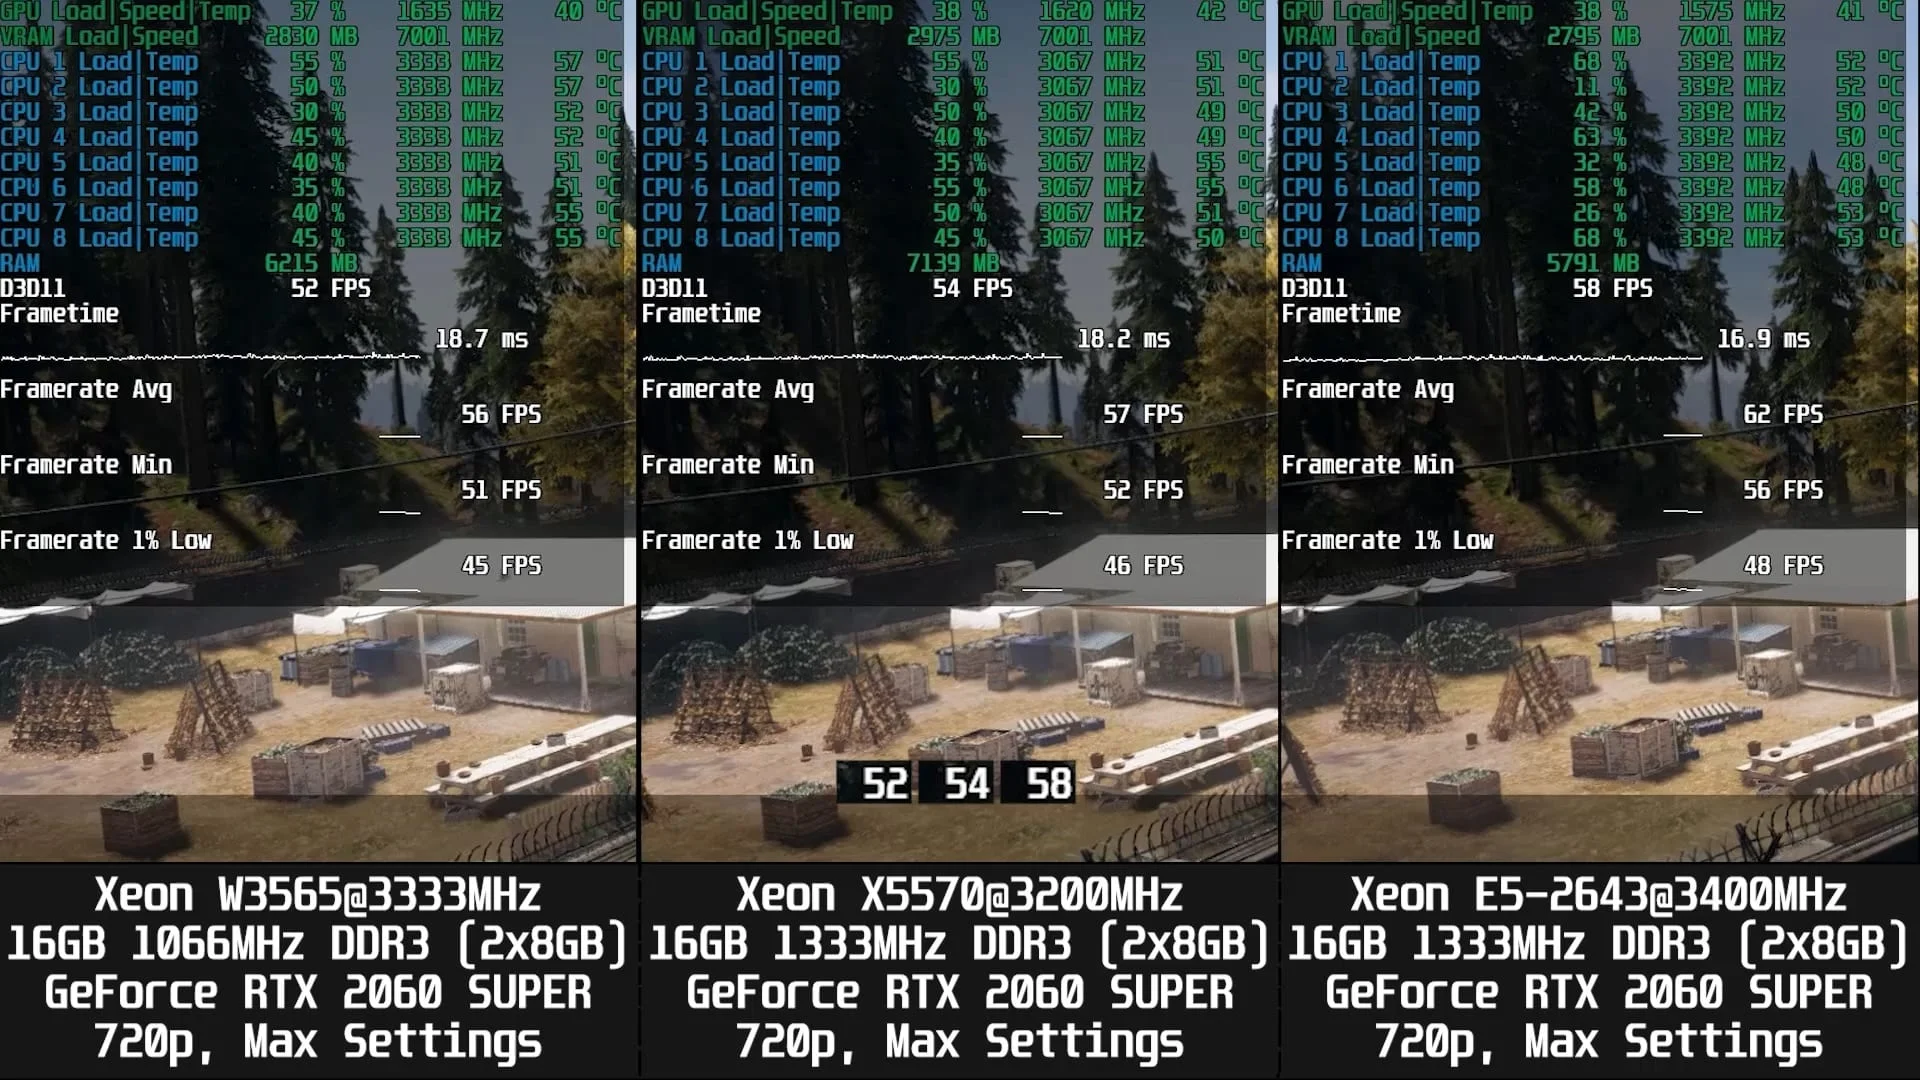 ⤢ ВІДКРИТИ
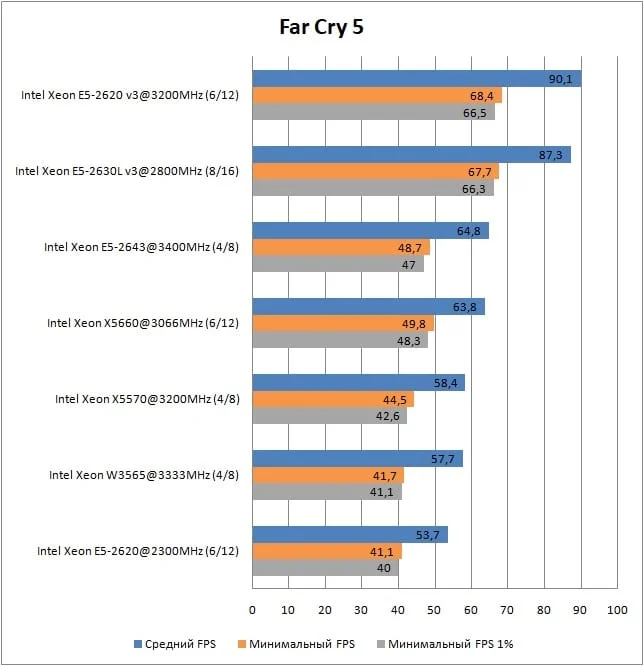 ⤢ ВІДКРИТИ
For Honor
 ⤢ ВІДКРИТИ
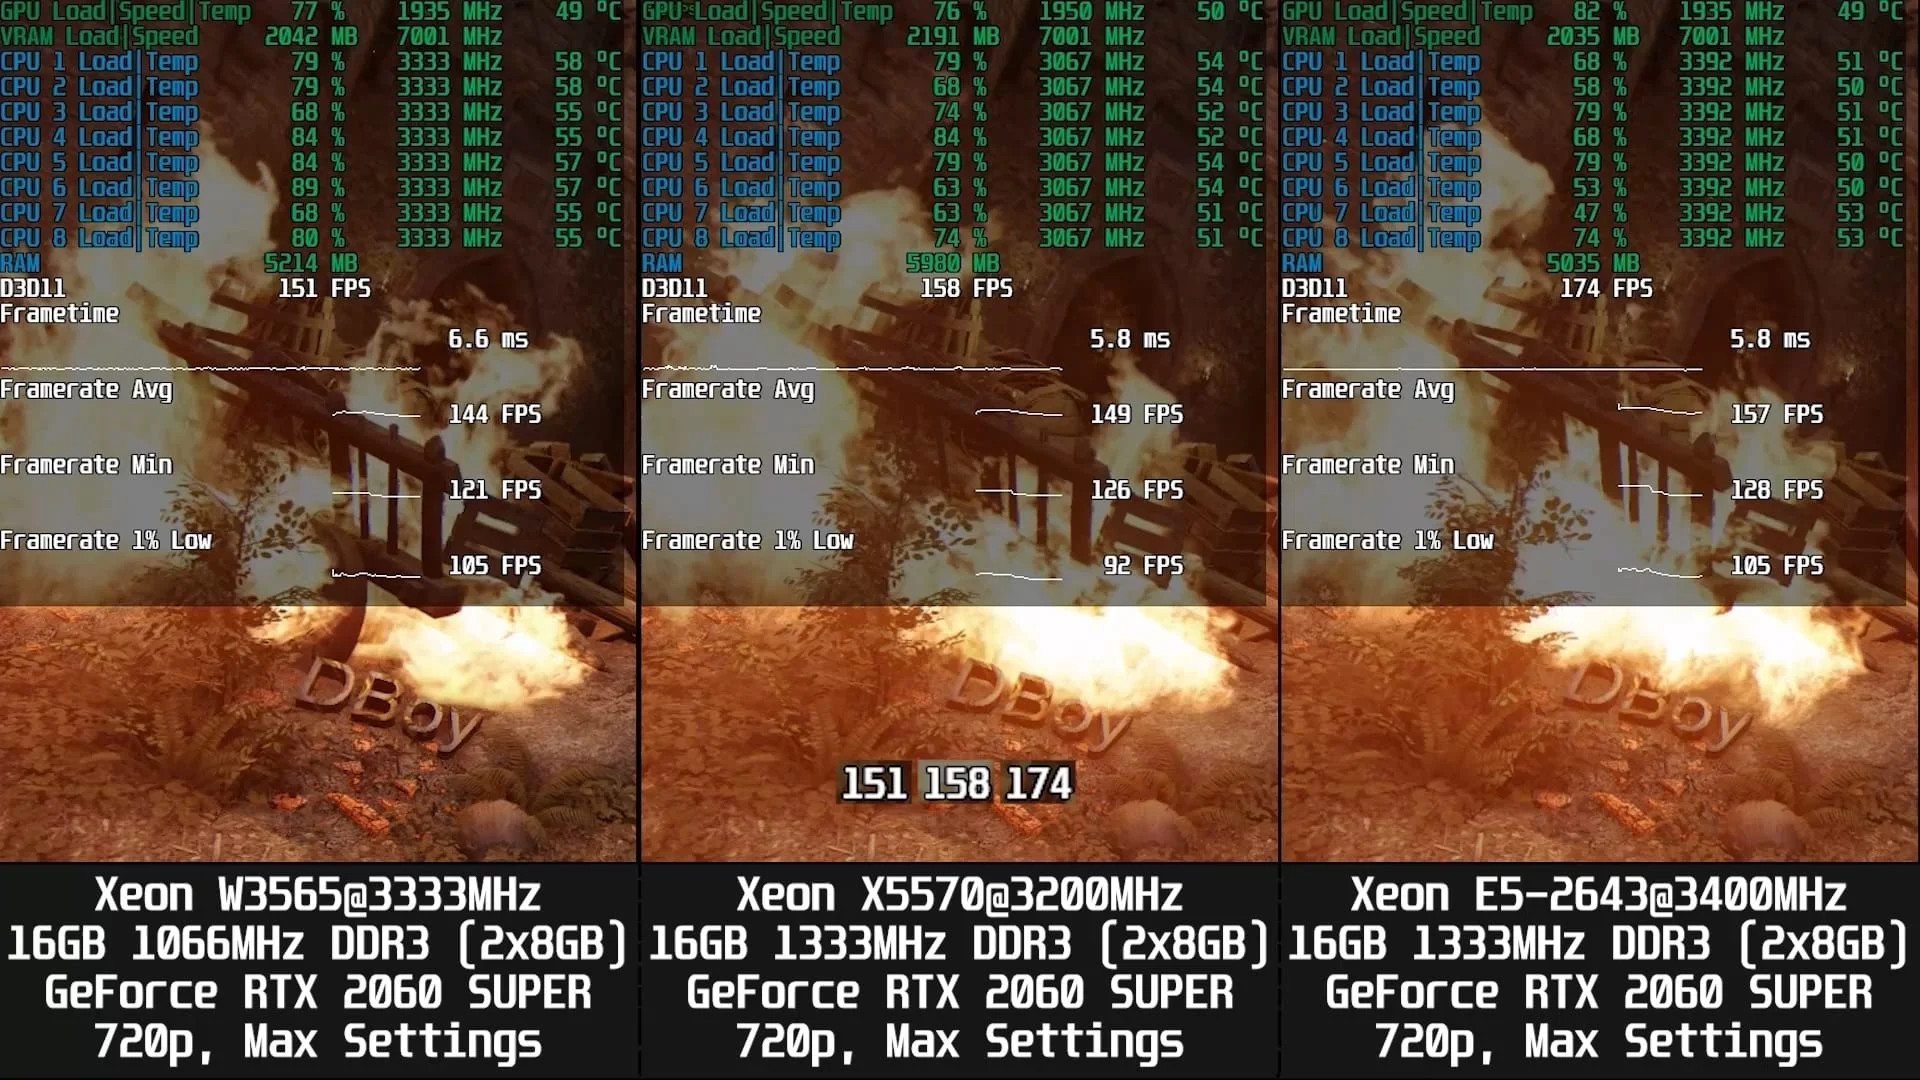 ⤢ ВІДКРИТИ
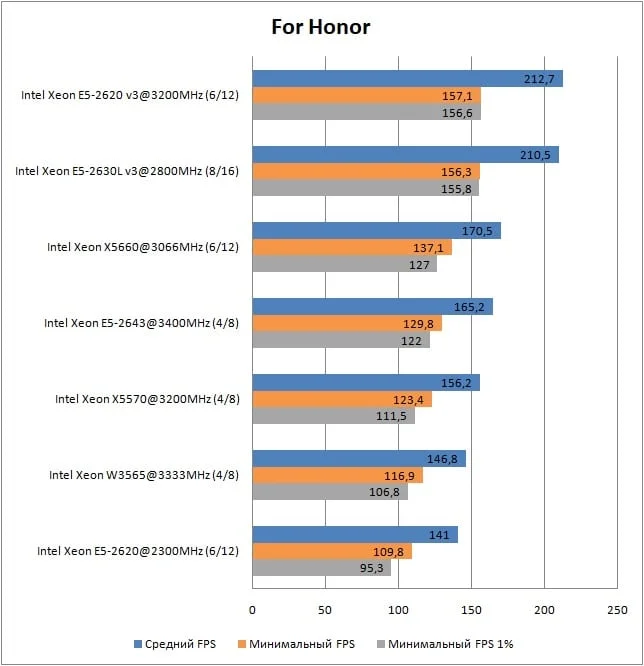 ⤢ ВІДКРИТИ
Horizon Zero Dawn
 ⤢ ВІДКРИТИ
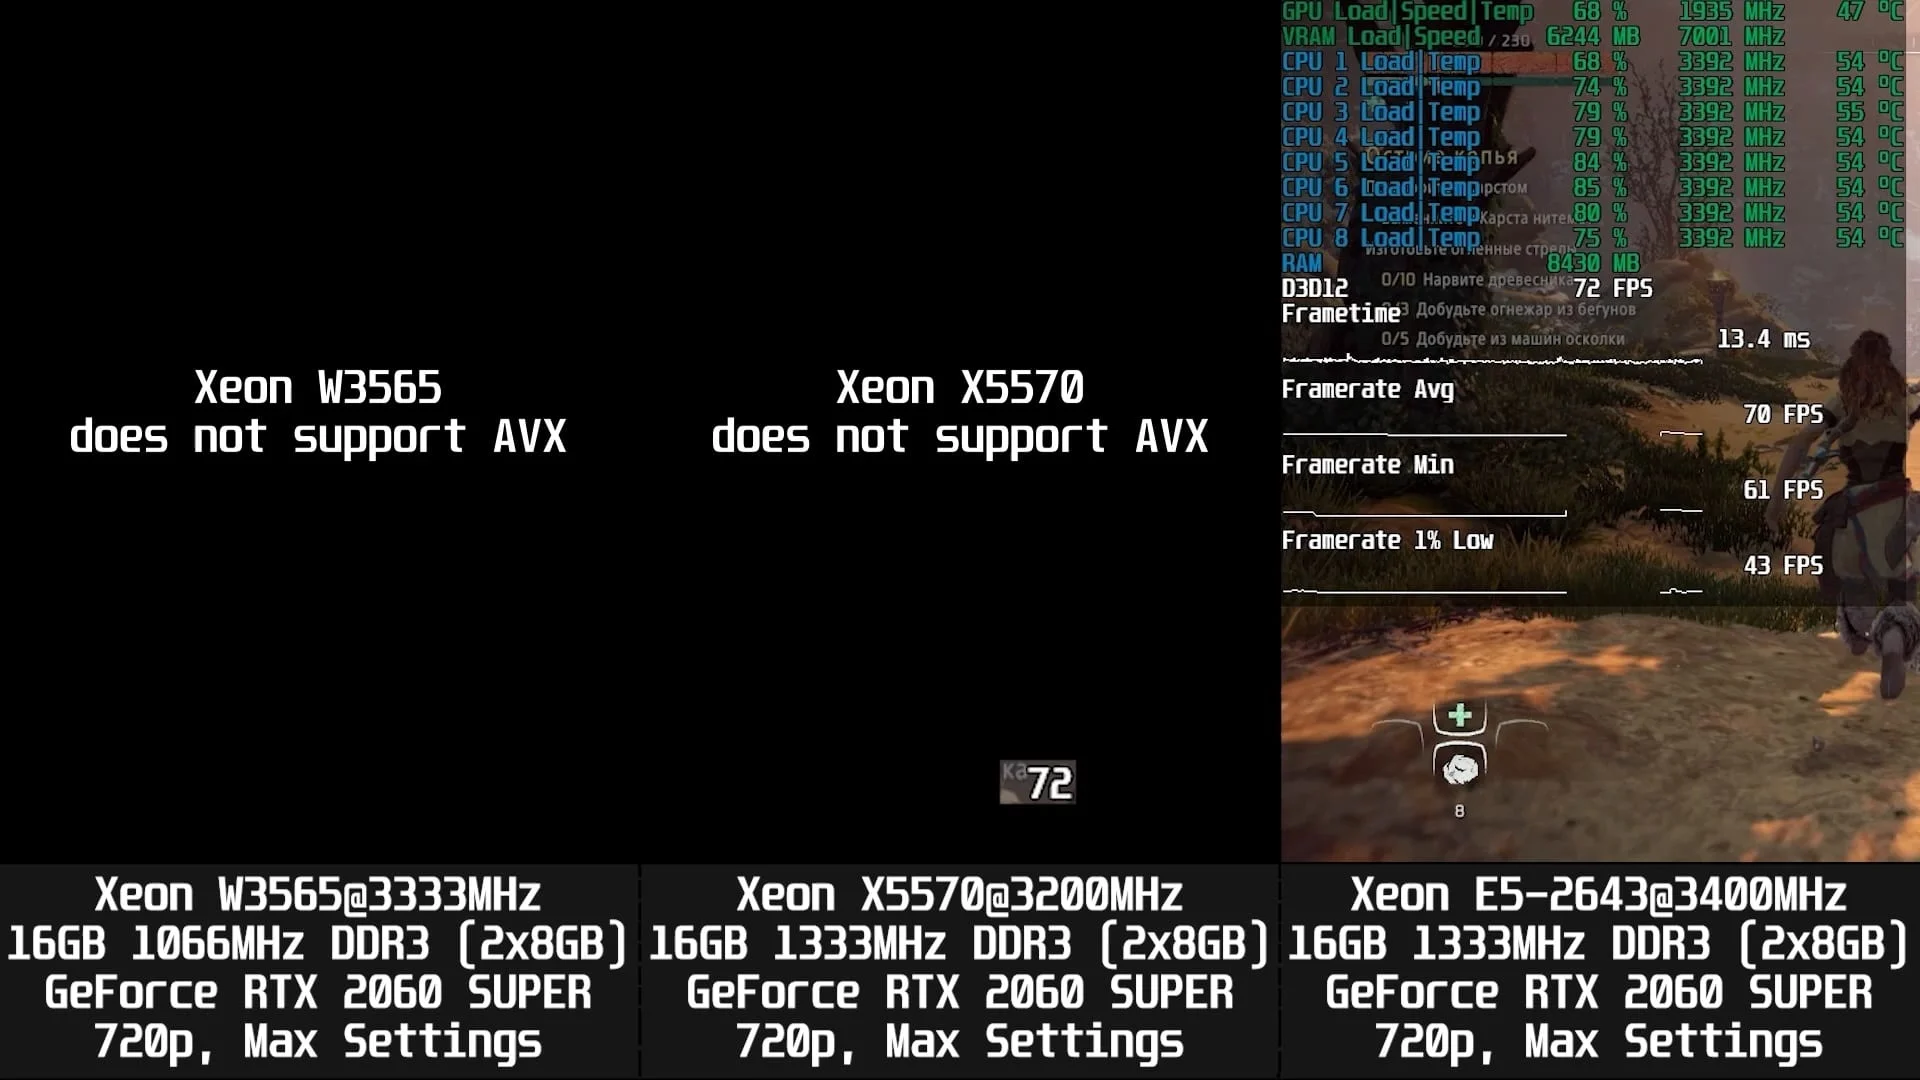 ⤢ ВІДКРИТИ
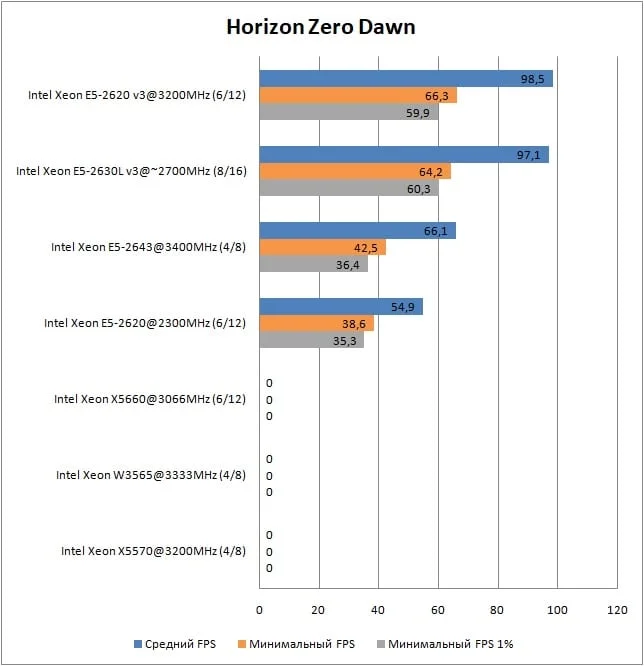 ⤢ ВІДКРИТИ
Red Dead Redemption 2
 ⤢ ВІДКРИТИ
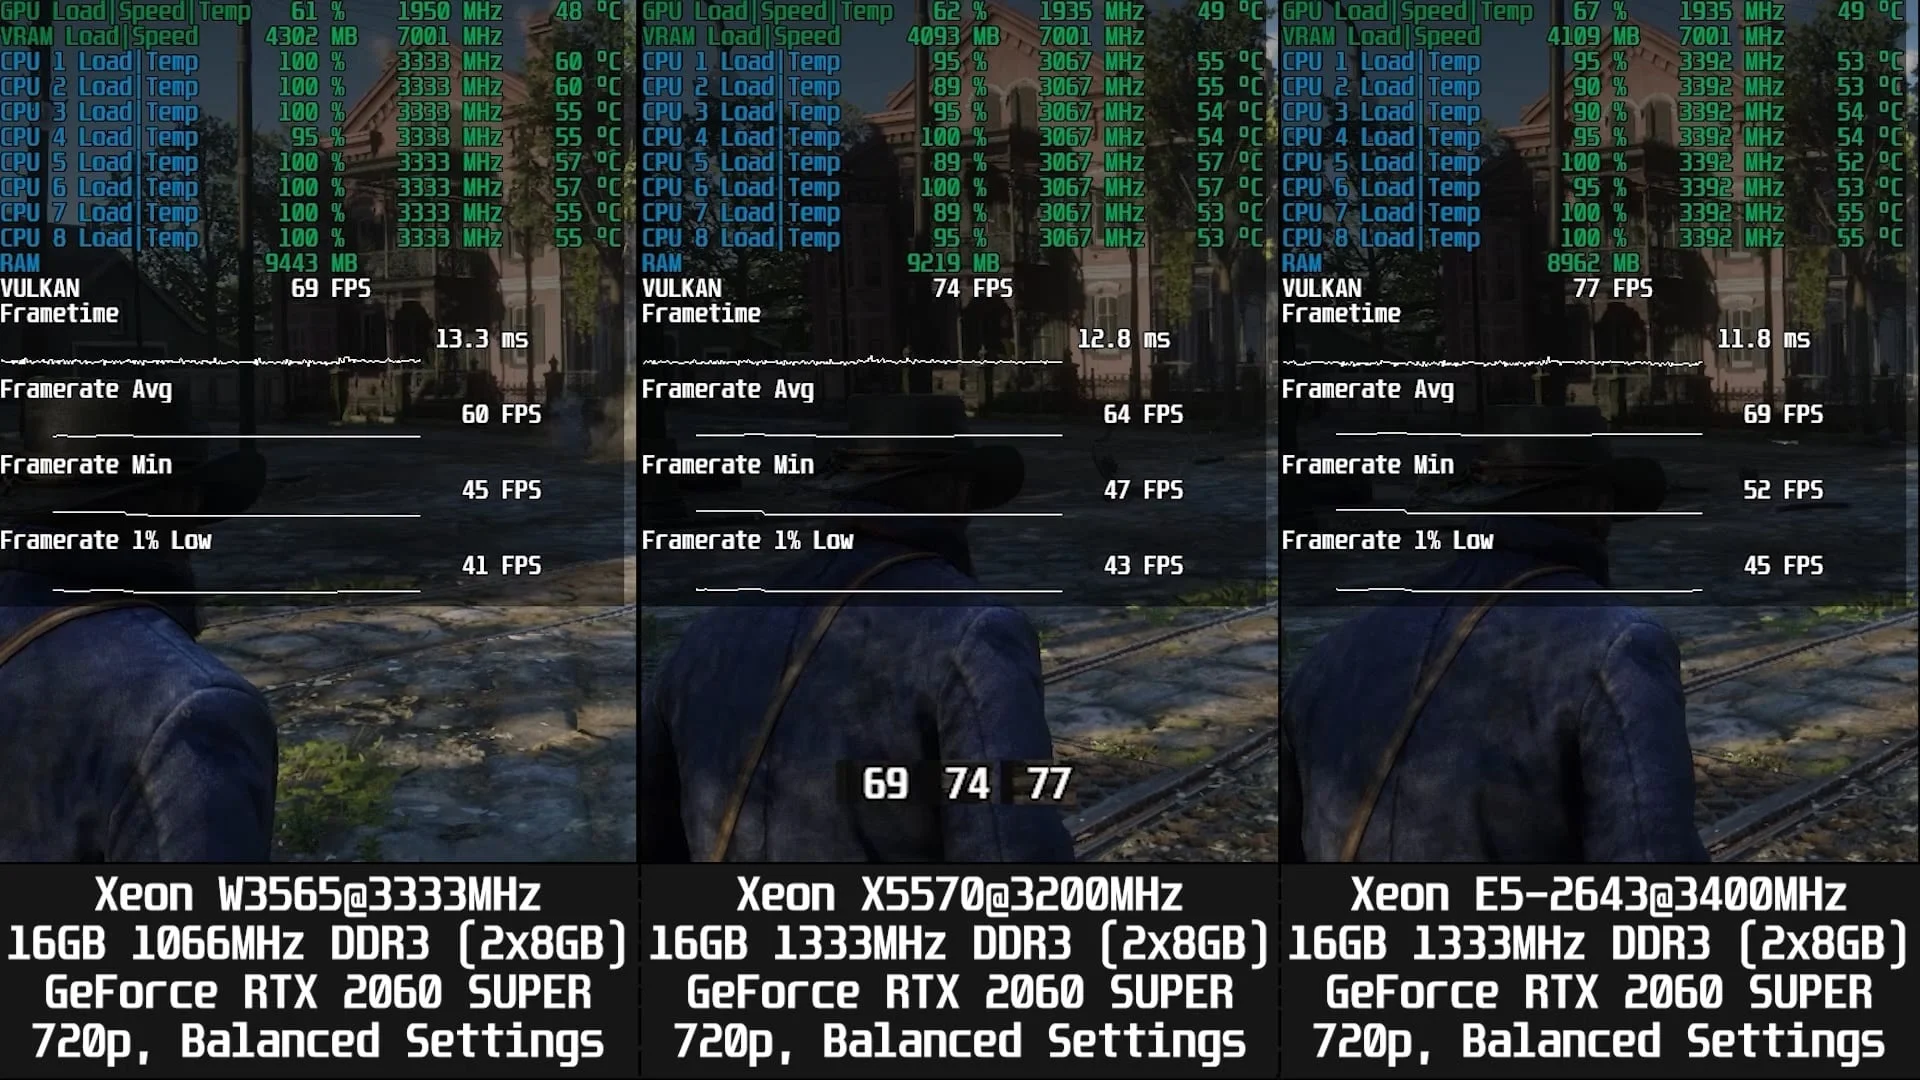 ⤢ ВІДКРИТИ
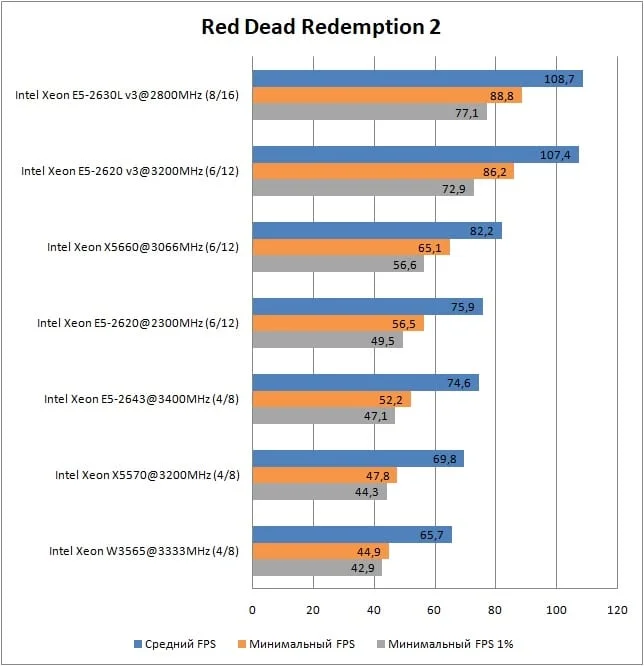 ⤢ ВІДКРИТИ
Remnant: From the Ashes
 ⤢ ВІДКРИТИ
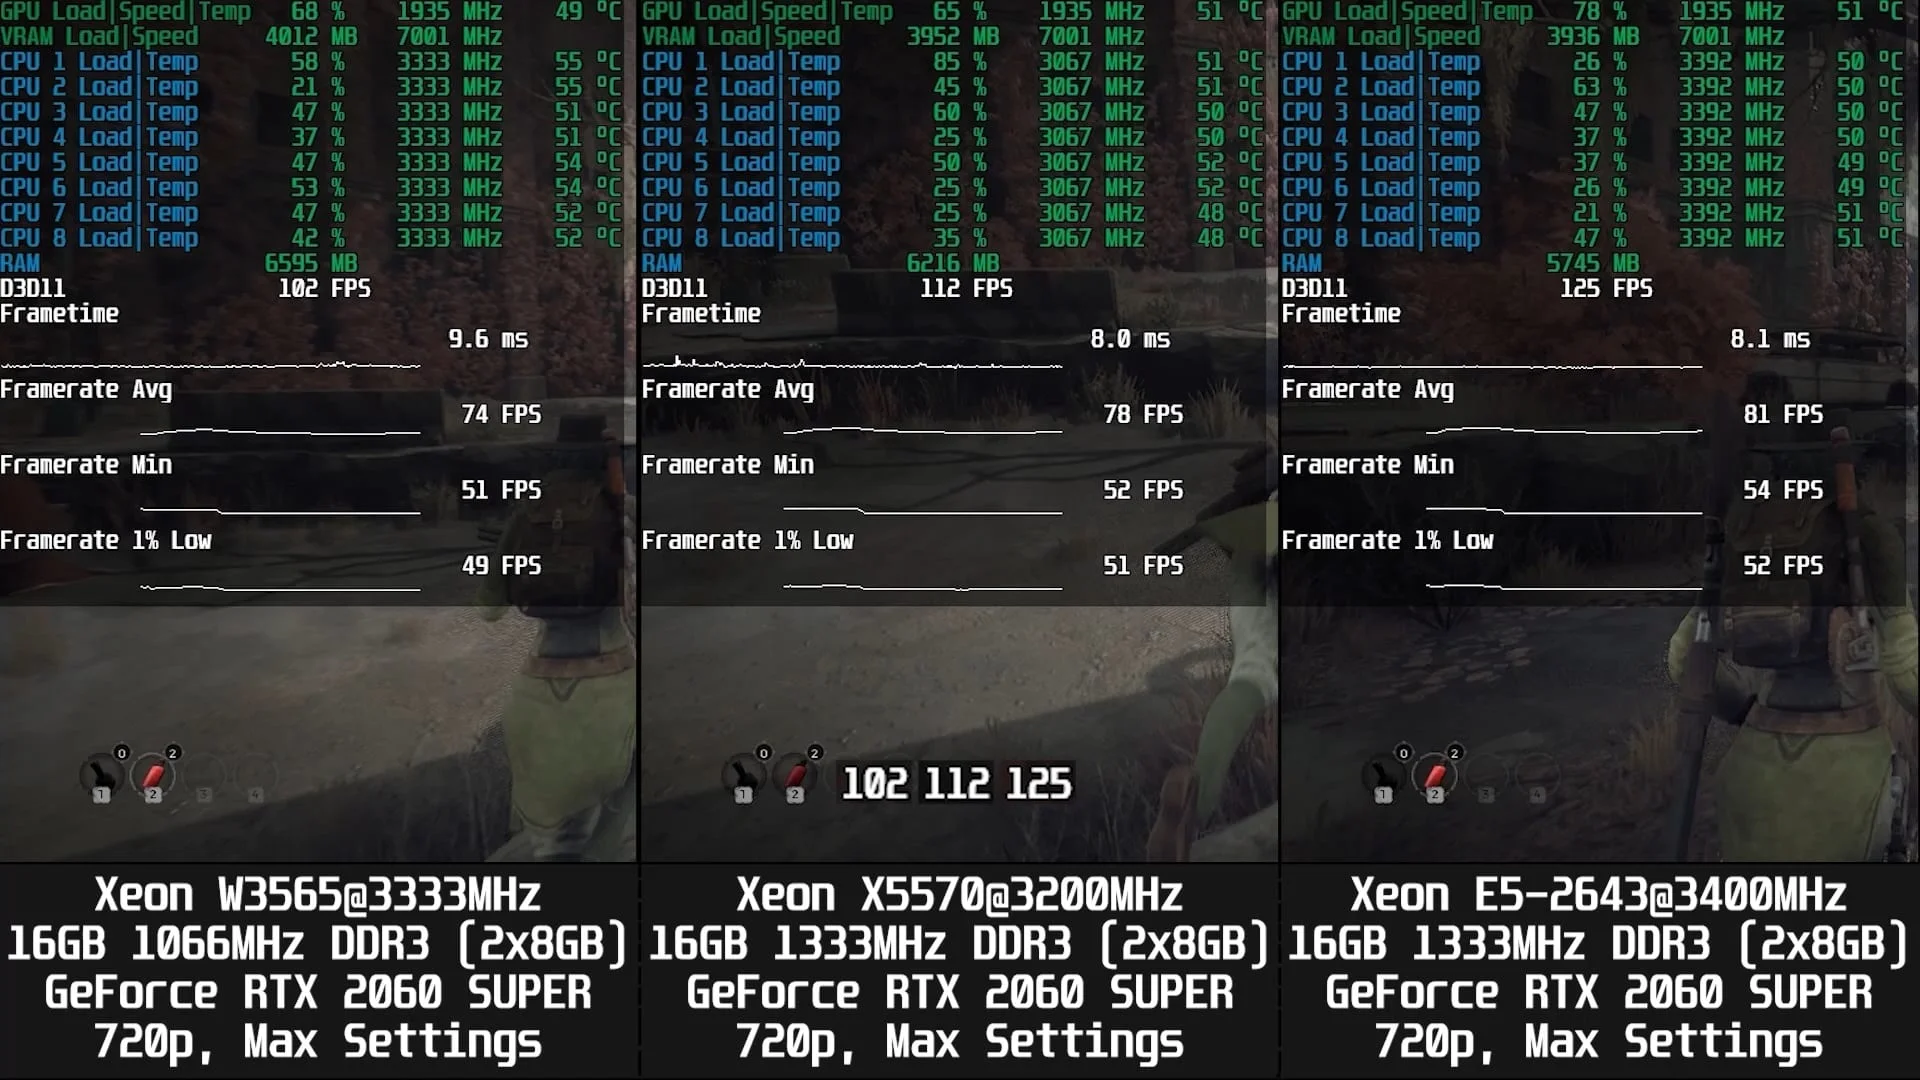 ⤢ ВІДКРИТИ
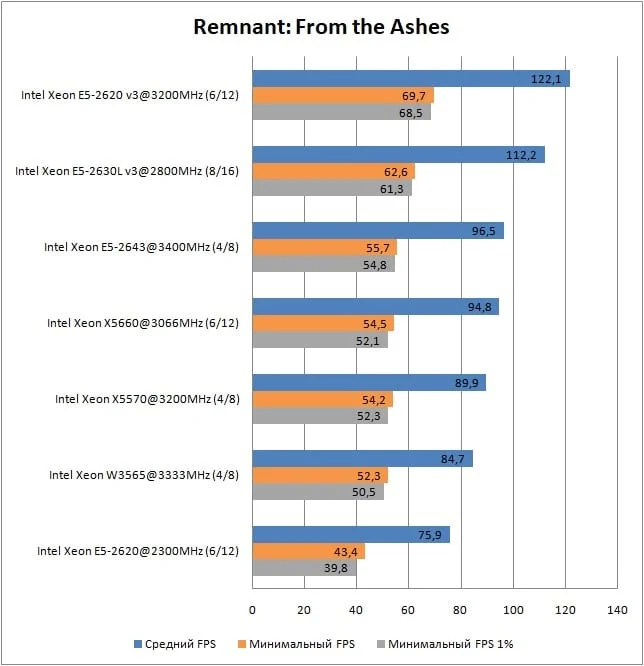 ⤢ ВІДКРИТИ
Shadow of the Tomb Raider
 ⤢ ВІДКРИТИ
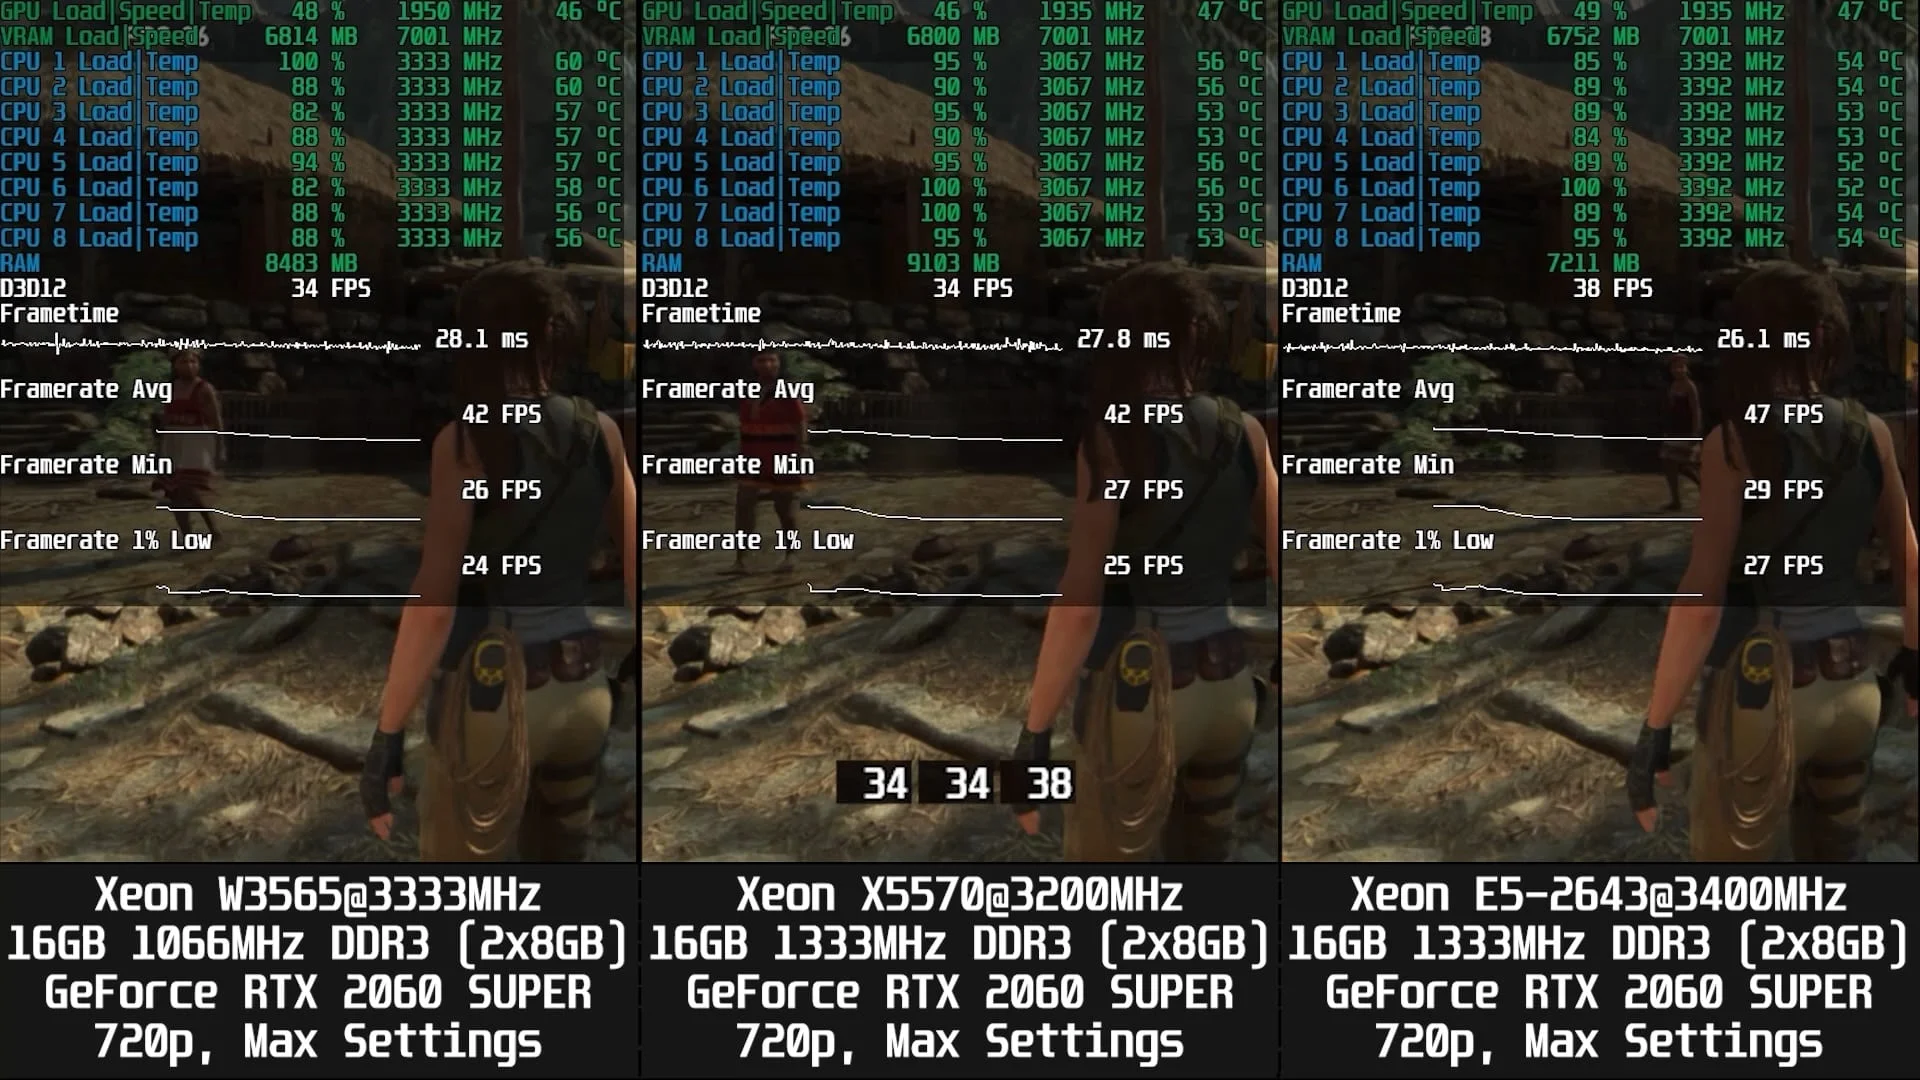 ⤢ ВІДКРИТИ
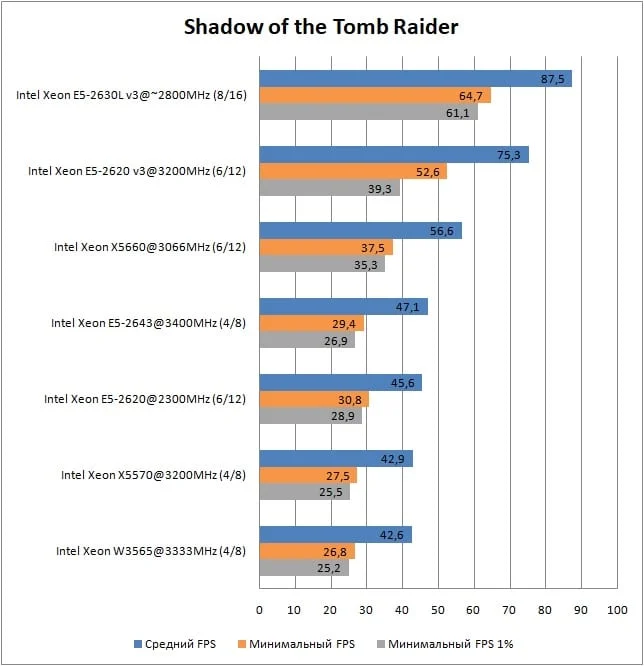 ⤢ ВІДКРИТИ
Tom Clancy’s The Division 2
 ⤢ ВІДКРИТИ
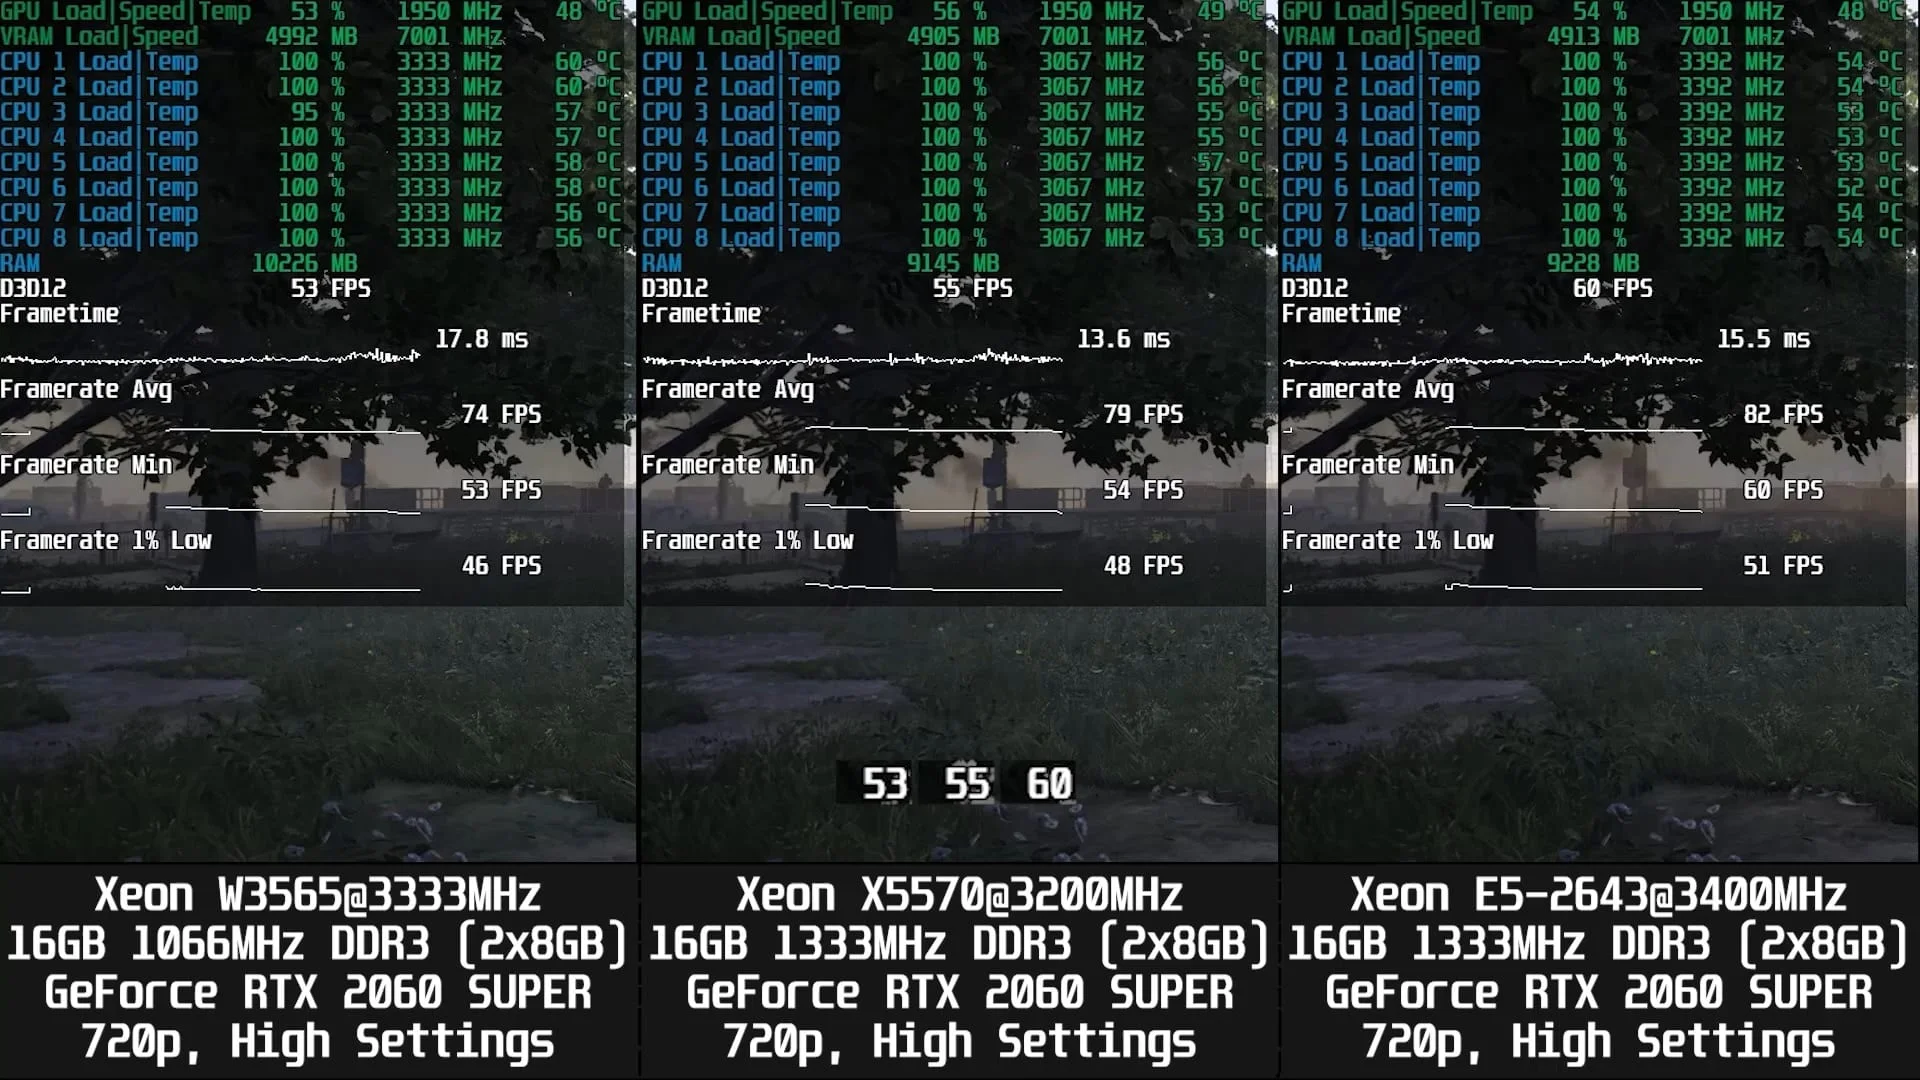 ⤢ ВІДКРИТИ
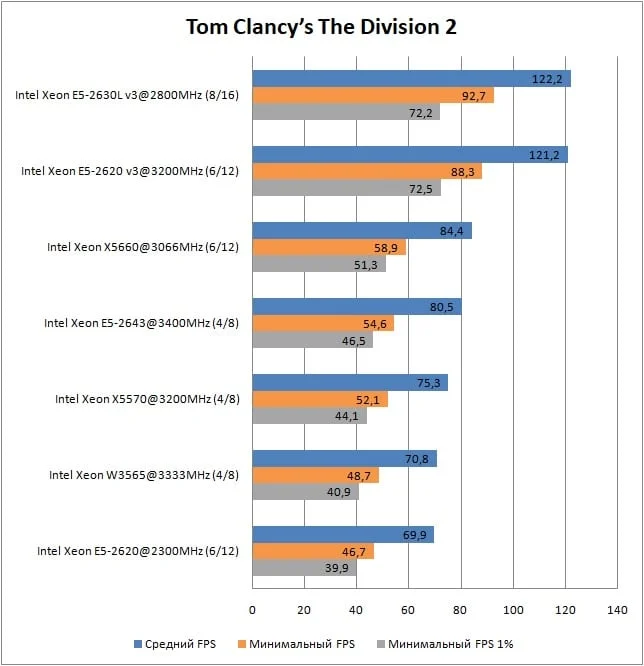 ⤢ ВІДКРИТИ
Watch_Dogs 2
 ⤢ ВІДКРИТИ
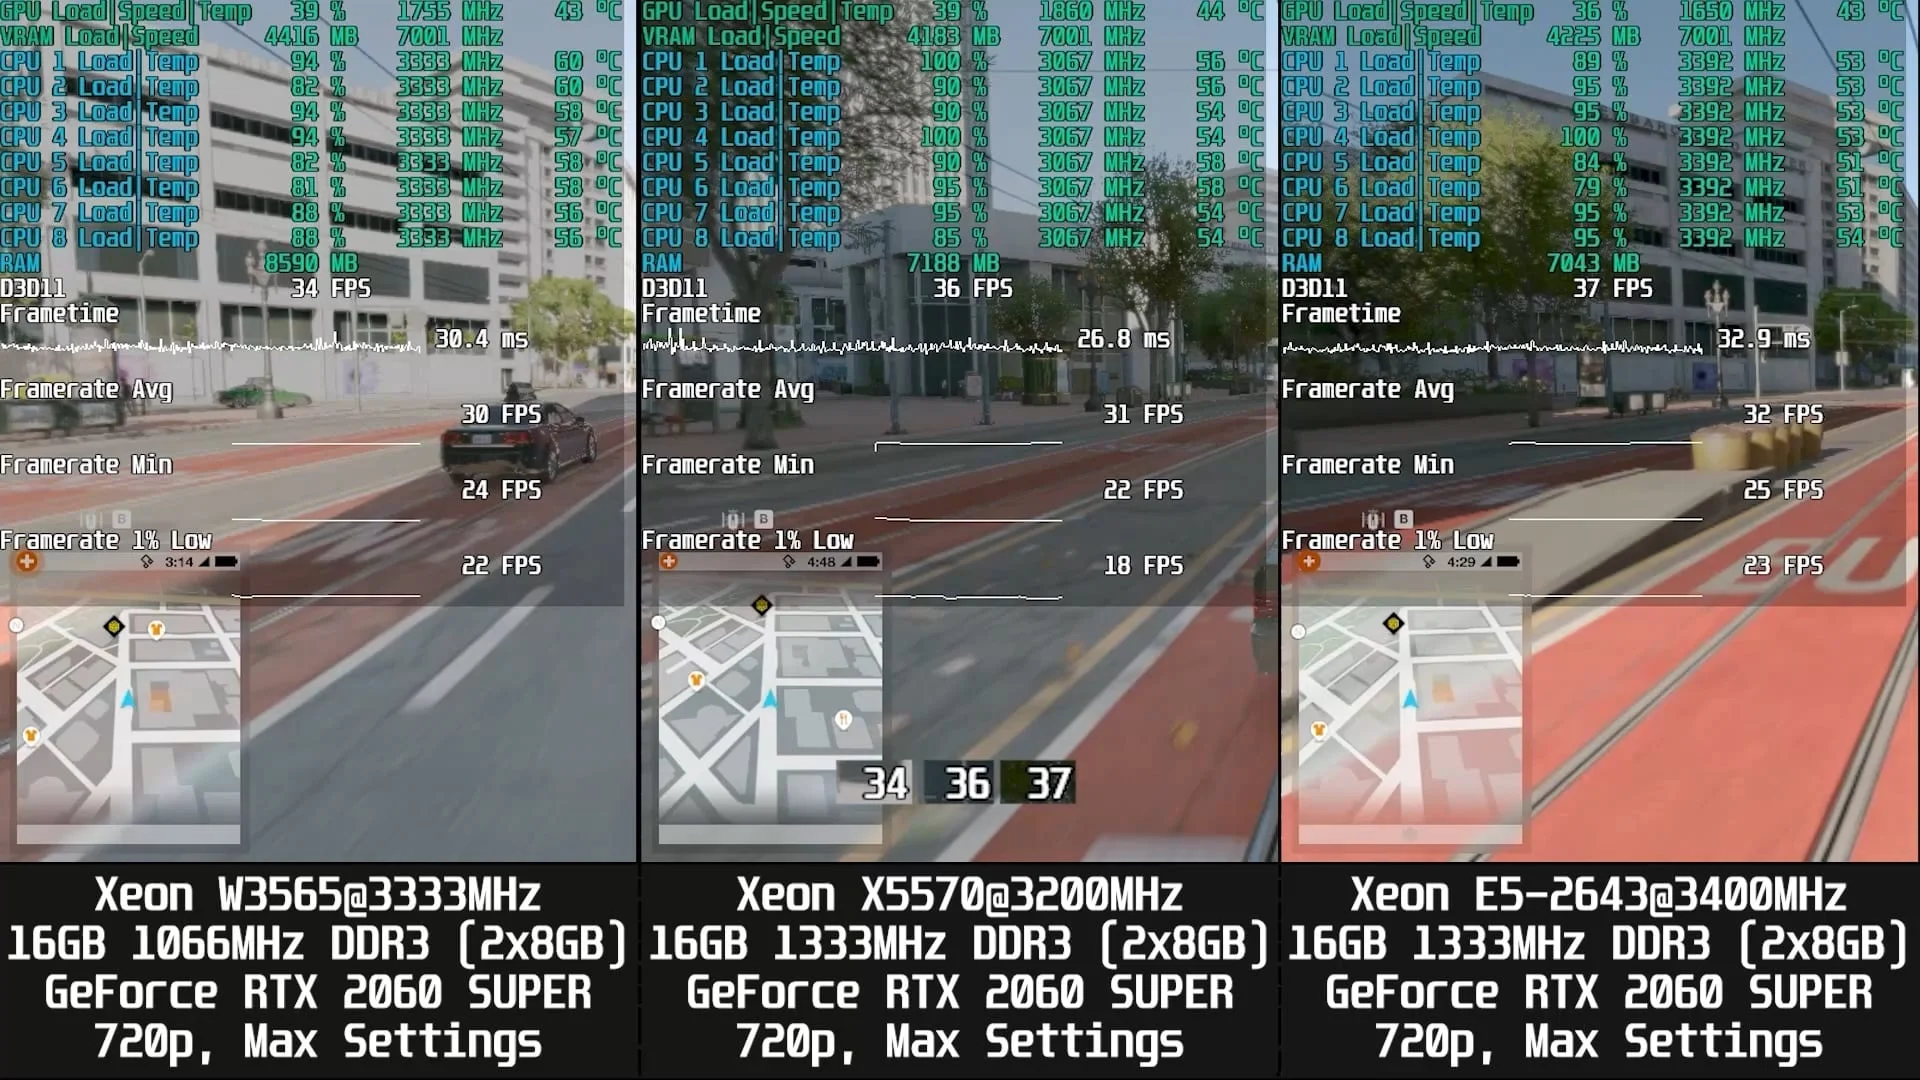 ⤢ ВІДКРИТИ
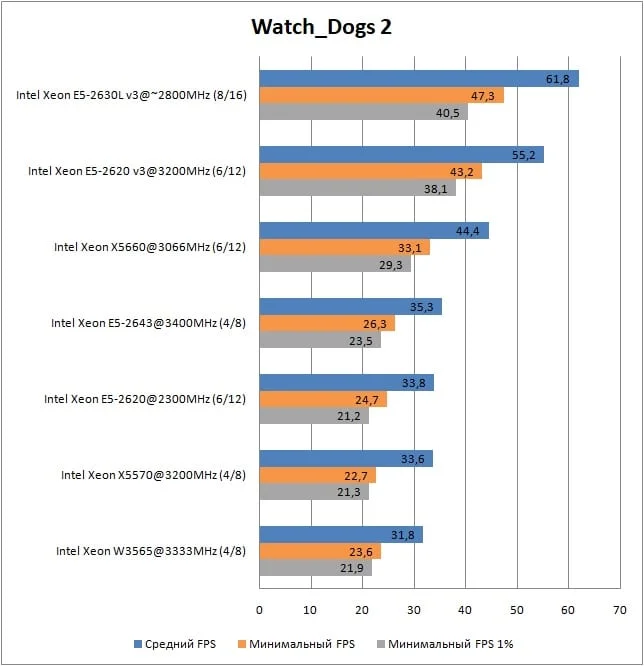 ⤢ ВІДКРИТИ
Ultimately, the slightly lower-clocked Xeon X5570 came out on top in 9 out of 13 games, beating its sibling, the W3565. While the W3565 performed better in Control, both CPUs delivered virtually identical results in Shadow of the Tomb Raider and Watch_Dogs 2, meaning any minor FPS differences can be chalked up to margin of error.
Game: | Xeon X5570 | Xeon W3565 |
Assassin’s Creed Odyssey | + | - |
Battlefield V | + | - |
Control Ultimate Edition | - | + |
Counter-Strike: Global Offensive | + | - |
Destiny 2 | + | - |
Far Cry 5 | + | - |
For Honor | + | - |
Horizon Zero Dawn | ||
Red Dead Redemption 2 | + | - |
Remnant: From the Ashes | + | - |
Shadow of the Tomb Raider | ~ | ~ |
Tom Clancy’s The Division 2 | + | - |
Watch_Dogs 2 | ~ | ~ |
The Xeon X5570's performance lead over the W3565 ranges from a minor 1.70% in Far Cry 5 to a significant 9.50% in the latest Battlefield, though it averages under 5%. Keep in mind, however, that the X5570's clock speed is 133 MHz lower than the W3565's. If they both ran at the same frequency, the X5570's performance advantage would be even more noticeable.
Game: | X5570 advantage over W3565: |
Assassin’s Creed Odyssey | 7.60% |
Battlefield V | 9.50% |
Control Ultimate Edition | -2.20% |
Counter-Strike: Global Offensive | 6.10% |
Destiny 2 | 3.00% |
Far Cry 5 | 1.70% |
For Honor | 6.80% |
Horizon Zero Dawn | 0.00% |
Red Dead Redemption 2 | 6.10% |
Remnant: From the Ashes | 5.90% |
Shadow of the Tomb Raider | 0.00% |
Tom Clancy’s The Division 2 | 7.10% |
Watch_Dogs 2 | 0.00% |
Below is a video of the Xeon W3565 being benchmarked in games. Keep in mind that the FPS figures in the charts above were recorded without background capture, which eats up some performance. As a result, the frame rates in the video are slightly lower than what you see on the charts.
YouTube
By loading, you allow content from YouTube (cookies may be set).
Wrapping up
Ultimately, my fears were both confirmed and disproven. On one hand, Nehalem's memory controller isn't refined enough to get a massive performance boost from 1333 MHz RAM and a 2666 MHz L3 cache. On the other hand, in Battlefield V, the chip with higher-frequency RAM and L3 cache delivered a nearly 10% performance uplift, even while running at a slightly lower frequency of 3200 MHz compared to 3333 MHz.
As for the performance of the Xeon W3565, today's testing makes it clear that it's in a pretty sad state. The lack of AVX instruction support completely kills any appeal for this CPU.
If you found this article helpful and want to see more content like this on the site, please support us on Patreon! Our main goal is to expand our hardware selection and improve benchmarking quality, which includes replacing HDDs with high-capacity SSDs, buying a capture card to reduce the impact of ShadowPlay recording on final results, and more. We would also like to send a special thank you to the patrons who have already signed up! Your support is incredibly important to us!